Article
- โชว์สินค้าทั้งหมด
- No categories
October 12, 2026
Ion Chromatography · Anion Test · IPC-TM-650 2.3.28 · Humidity and Tropical Climate · Automotive Electronics Reliability
ISO/IEC 17025 Accredited Testing Where Applicable | Anion and Cation Analysis | Chemical and Electronics Testing Malaysia
Automotive electronics assemblies are designed to operate reliably across a defined range of environmental conditions for the full service life of the vehicle. In markets with high ambient humidity and temperature, including Malaysia and the broader Southeast Asia region, the environmental stresses on automotive PCBs are more demanding than in temperate climates. Ionic contamination that might remain inert in a dry continental environment can become electrochemically active within months in a tropical climate.
Ionic contamination testing by ion chromatography, commonly known as the anion test in electronics manufacturing, is the analytical method that identifies and quantifies the ionic residues on a PCB assembly before it is installed in a vehicle. It is the test that finds contamination invisible to optical inspection and undetectable by functional testing under dry conditions, before it causes failures in the field.
Why Harsh Environments Increase Ionic Contamination Risk
The mechanism by which ionic contamination causes PCB failures depends on moisture. Ionic residues on a PCB surface are typically insoluble and electrochemically inactive under dry conditions. When humidity rises above a threshold level, typically around 65 to 75 percent relative humidity depending on the specific ionic species, the residues absorb moisture and dissolve into a thin electrolytic film on the board surface. This film becomes conductive, creating leakage paths between adjacent conductors and, under applied voltage, driving electrochemical reactions that corrode conductors and grow metallic dendrites between circuit nodes.
In Malaysia and across Southeast Asia, ambient relative humidity regularly exceeds 80 percent and can approach 90 percent or higher in coastal and low-lying areas. Vehicle interiors in these markets experience sustained humidity exposure even with air conditioning, particularly during parking periods and at night. The combination of high ambient humidity, temperature cycling between day and night, and the presence of ionic residues creates conditions where failures can develop significantly faster than in temperate climate markets.
This is why automotive OEMs supplying vehicles to Southeast Asian markets, and the component manufacturers in Malaysia supplying their electronics assemblies, increasingly require ionic contamination testing as a standard qualification step, regardless of whether it was required for the same component being supplied to European or North American programmes.
What Ionic Contamination Testing Measures
Ionic contamination testing by ion chromatography analyses an extract from the PCB surface and identifies every ionic species present, quantifying each one individually. The test covers three categories of ionic species defined in IPC-TM-650 2.3.28.
Anions
Including fluoride, chloride, bromide, nitrite, nitrate, phosphate, and sulfate. Chloride is the most significant from a corrosion risk perspective, as it is highly mobile, highly soluble, and a known aggressive initiator of pitting corrosion and dendritic growth even at low concentrations.
Cations
Including lithium, sodium, ammonium, potassium, magnesium, and calcium. Ammonium is the most diagnostically significant cation in electronics failure investigations, as elevated ammonium indicates the presence of incompletely deactivated no-clean flux activator residues that retain corrosion-promoting and hygroscopic properties.
Weak organic acids (WOA)
Including acetate, formate, citrate, malate, succinate, methanesulfonate, and phthalate. WOA species are characteristic markers of flux chemistry residues, particularly from no-clean flux formulations, and their presence indicates residues that can promote leakage current and under-board corrosion in humid conditions.
The result for each species is expressed in micrograms per square centimetre of board surface, and each result is compared against the acceptance limits defined in the applicable cleanliness specification.
Typical Acceptance Limits for Automotive PCBs
Ionic Species
Typical Limit (μg/cm²)
Notes
Chloride (Cl⁻)
0.5 – 1.5
Most critical for corrosion risk
Sulfate (SO₄²⁻)
1.5 – 3.0
Common from plating chemistries
Sodium (Na⁺)
1.5 – 3.0
Indicates handling contamination
Ammonium (NH₄⁺)
5.0 – 10.0
No-clean flux activator residue
Total WOA
10.0 – 20.0
Flux chemistry marker
Limits vary by OEM specification. Tropical market programmes may apply tighter limits than global defaults.
Tropical Climate Considerations for Malaysian Automotive Electronics Manufacturers
For electronics manufacturers in Malaysia supplying automotive programmes, several factors specific to the regional environment are relevant to ionic contamination testing and specification.
Higher humidity baseline means tighter effective limits.
A contamination level that falls within a standard acceptance limit defined for a temperate-market application may still drive failures in a tropical market application where board surfaces are exposed to higher average humidity. Automotive OEMs with specific tropical or Southeast Asian market programmes sometimes apply tighter ionic contamination limits than their global default specifications to account for the higher humidity baseline.
No-clean flux residues are more of a concern.
No-clean flux formulations are widely used in electronics assembly because they eliminate the cleaning step. In dry environments, the residues from no-clean fluxes are generally benign. In high-humidity environments, certain no-clean flux residues, particularly those with elevated ammonium and WOA species, absorb moisture and become electrochemically active. IC analysis that includes WOA testing alongside standard anion and cation analysis provides a more complete picture of contamination risk for assemblies destined for tropical market use.
Conformal coating cannot substitute for cleanliness.
Conformal coating is applied to many automotive PCBs to provide a barrier against environmental exposure. However, conformal coating applied over ionic contamination traps the residues beneath the coating in an environment where moisture can still migrate through or around the coating over time. The industry consensus and most OEM specifications require ionic contamination limits to be met before conformal coating application, not after.
How the Test Is Performed
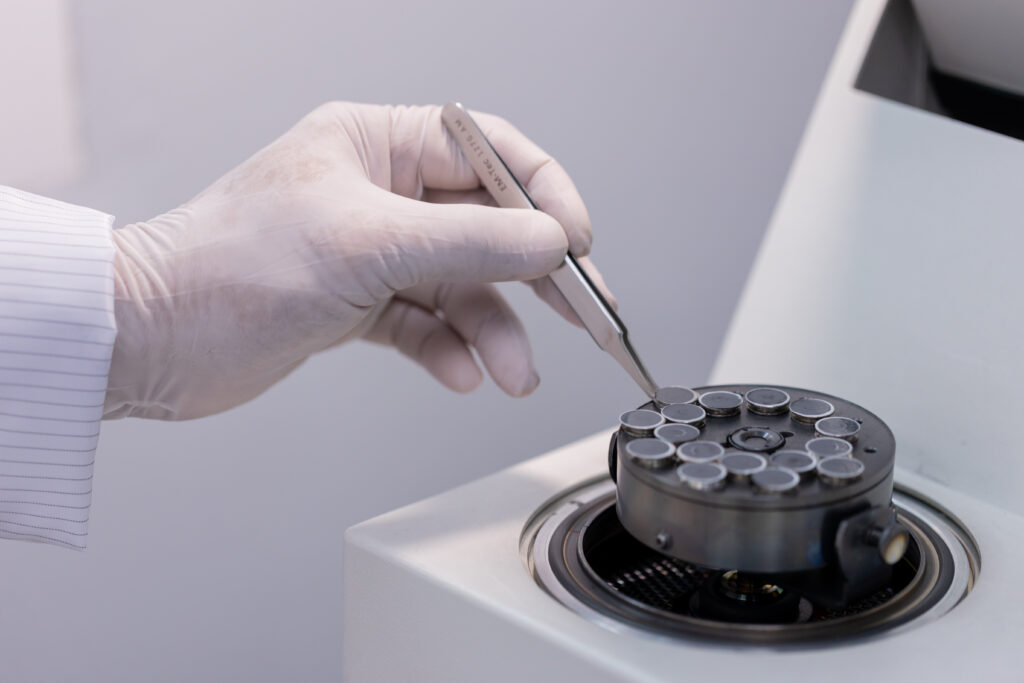
Ionic contamination testing follows the extraction and analysis procedure defined in IPC-TM-650 2.3.28. The PCB assembly is placed in a clean vessel and covered with a defined volume of extraction solvent, a mixture of 75 percent isopropyl alcohol and 25 percent deionised water. The extraction is conducted at 80°C for one hour under agitation, dissolving ionic species from the board surface including flux residues not fully soluble in water alone.
The extract is filtered and injected into the ion chromatography system. Anion and cation analysis are performed on separate chromatographic columns using the appropriate separation conditions for each ion class. WOA analysis uses a dedicated low-capacity column optimised for organic acid separation. Results are reported with individual species concentrations in micrograms per square centimetre alongside the applicable specification limits and pass or fail designation for each species.
Sample Preparation and Turnaround
Specimens should be sealed in clean polyethylene bags immediately after assembly
Handle only with powder-free gloves to prevent handling contamination
Complete extraction and analysis within four days of assembly to minimise ionic species migration or degradation
Typical turnaround time: three to five working days from sample receipt, depending on species analysed and laboratory workload
Ionic Contamination Testing in the Qualification Workflow
For automotive electronics manufacturers in Malaysia, ionic contamination testing most commonly enters the production workflow at two points.
Process qualification and PPAP.
When establishing or validating the assembly process, IC testing confirms that the combination of flux type, soldering process, and cleaning or no-clean process produces ionic contamination levels within the OEM-specified limit. This data is typically submitted as part of the production part approval process (PPAP) package.
Production monitoring.
Periodic IC testing of production samples provides ongoing process monitoring data, confirming that contamination levels remain within the qualified range as production continues. Where periodic testing identifies a drift toward the specification limit, it triggers investigation before the limit is exceeded and before affected assemblies reach the customer.
Failure investigation.
When a field return or qualification test failure involves corrosion, leakage current, or intermittent electrical behaviour, IC testing of the affected assembly is typically the first analytical step in characterising the ionic contamination profile. For a detailed explanation of how IC is used in PCB failure analysis, see our guide on ion chromatography for PCB failure analysis.
Frequently Asked Questions
What is an anion test for automotive PCBs?
An anion test is a common shorthand for ionic contamination testing by ion chromatography. It identifies and quantifies the anionic species (negatively charged ions) present on a PCB surface, including chloride, fluoride, bromide, sulfate, and other anions. A complete ionic contamination test also covers cations and weak organic acids. The method is defined in IPC-TM-650 2.3.28. Why is ionic contamination more of a concern in Malaysia than in Europe? The higher average ambient humidity in Malaysia and Southeast Asia means that ionic residues on PCB surfaces are exposed to moisture activation more frequently and for longer periods than in temperate markets. Residues that remain inert in a dry European environment can become electrochemically active and drive corrosion or dendritic growth in the Malaysian climate. Automotive OEMs with Southeast Asian market programmes sometimes specify tighter ionic contamination limits to account for this. Does conformal coating eliminate the need for ionic contamination testing? No. Conformal coating provides a barrier against direct moisture contact but does not remove ionic residues from the board surface. Ionic species trapped beneath conformal coating can still activate over time as moisture migrates through the coating. Most OEM specifications require ionic contamination limits to be met before conformal coating is applied. What ionic species are most significant for automotive PCBs in tropical climates? Chloride is the most significant anion due to its aggressive corrosion behaviour at low concentrations. Ammonium and weak organic acid species are significant because they indicate active no-clean flux residues that absorb moisture and promote leakage current, which is particularly problematic in high-humidity environments. A complete IC test covering anions, cations, and WOA provides the most relevant picture for tropical market applications. What is the difference between ROSE testing and ion chromatography? ROSE testing (IPC-TM-650 2.3.25) measures bulk ionic cleanliness by conductivity and reports total ionic contamination as an equivalent amount of sodium chloride. It does not identify which ionic species are present. Ion chromatography (IPC-TM-650 2.3.28) identifies and quantifies each individual ionic species. For automotive applications, especially in tropical climates, ion chromatography provides more diagnostic information because it distinguishes between benign residues and aggressive corrosion promoters such as chloride and ammonium. Next Steps See our full Chemical and Electronics Testing services including ionic contamination analysis Read our guide on PCB cleanliness testing and ion chromatography See our Technical Cleanliness Testing services for precision component cleanliness Contact our team for an ionic contamination testing quotation or technical discussion ISO/IEC 17025 Accredited Testing Where Applicable | Anion and Cation Analysis for Automotive Electronics | Chemical and Electronics Testing Malaysia
Read moreAn anion test is a common shorthand for ionic contamination testing by ion chromatography. It identifies and quantifies the anionic species (negatively charged ions) present on a PCB surface, including chloride, fluoride, bromide, sulfate, and other anions. A complete ionic contamination test also covers cations and weak organic acids. The method is defined in IPC-TM-650 2.3.28. Why is ionic contamination more of a concern in Malaysia than in Europe? The higher average ambient humidity in Malaysia and Southeast Asia means that ionic residues on PCB surfaces are exposed to moisture activation more frequently and for longer periods than in temperate markets. Residues that remain inert in a dry European environment can become electrochemically active and drive corrosion or dendritic growth in the Malaysian climate. Automotive OEMs with Southeast Asian market programmes sometimes specify tighter ionic contamination limits to account for this. Does conformal coating eliminate the need for ionic contamination testing? No. Conformal coating provides a barrier against direct moisture contact but does not remove ionic residues from the board surface. Ionic species trapped beneath conformal coating can still activate over time as moisture migrates through the coating. Most OEM specifications require ionic contamination limits to be met before conformal coating is applied. What ionic species are most significant for automotive PCBs in tropical climates? Chloride is the most significant anion due to its aggressive corrosion behaviour at low concentrations. Ammonium and weak organic acid species are significant because they indicate active no-clean flux residues that absorb moisture and promote leakage current, which is particularly problematic in high-humidity environments. A complete IC test covering anions, cations, and WOA provides the most relevant picture for tropical market applications. What is the difference between ROSE testing and ion chromatography? ROSE testing (IPC-TM-650 2.3.25) measures bulk ionic cleanliness by conductivity and reports total ionic contamination as an equivalent amount of sodium chloride. It does not identify which ionic species are present. Ion chromatography (IPC-TM-650 2.3.28) identifies and quantifies each individual ionic species. For automotive applications, especially in tropical climates, ion chromatography provides more diagnostic information because it distinguishes between benign residues and aggressive corrosion promoters such as chloride and ammonium. Next Steps See our full Chemical and Electronics Testing services including ionic contamination analysis Read our guide on PCB cleanliness testing and ion chromatography See our Technical Cleanliness Testing services for precision component cleanliness Contact our team for an ionic contamination testing quotation or technical discussion ISO/IEC 17025 Accredited Testing Where Applicable | Anion and Cation Analysis for Automotive Electronics | Chemical and Electronics Testing Malaysia
October 12, 2026
Microsection Preparation · Coating Thickness · Interface Analysis · SEM-EDX · Failure Investigation
ISO/IEC 17025 Accredited Testing Where Applicable | Cross-Section and Microsection Analysis | Failure Analysis Services Malaysia
Most failures in automotive components originate beneath the surface. A coating that looks intact under optical inspection may have already debonded from its substrate at the interface. A solder joint that passes visual inspection may contain cracks propagating through the intermetallic layer. A plated surface may have voids or inclusions in the deposit that act as initiation sites for corrosion. Cross-section analysis makes these subsurface features visible.
Cross-section analysis, also called microsection analysis or metallographic sectioning, involves cutting through a component at the site of interest, mounting the cut face in resin, and preparing the surface by grinding and polishing to a metallographic finish. What is revealed at the cut face is a two-dimensional view of the component’s internal structure at that location, at a scale and resolution that other analytical techniques cannot access without destructive preparation.
What Is Cross-Section Analysis
Cross-section analysis is a destructive preparation technique used to expose the internal microstructure of a component at a defined location. The process begins with selecting the exact cut location based on the failure site or the feature of interest identified during prior non-destructive examination. The component is then embedded in a low-shrinkage resin that fills any internal voids and supports the sample during subsequent preparation.
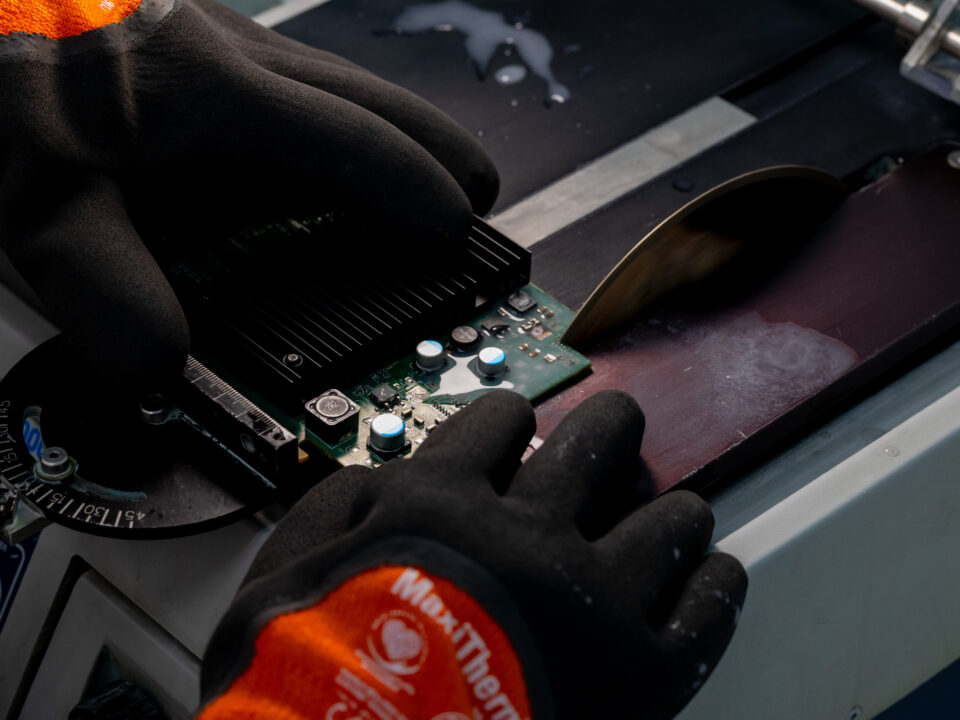
After the resin has cured, the embedded sample is cut through the area of interest using a precision saw or a slow-speed cutting wheel. The cut face is then ground through a series of progressively finer abrasive grades and finally polished to a mirror-like metallographic finish. Optional chemical or electrochemical etching of the polished surface reveals grain boundaries and phase structures that are not visible in the unetched condition.
The prepared cross-section can then be examined by optical microscopy, scanning electron microscopy (SEM), and energy-dispersive X-ray spectroscopy (EDX). The combination of cross-section preparation with SEM-EDX is particularly powerful, as it allows elemental composition analysis at specific points, lines, and areas across the cross-section, revealing coating composition, interface chemistry, and the elemental distribution within individual microstructural features.
Key Preparation Parameters
Mounting resin: low-shrinkage epoxy or acrylic to preserve edge definition and prevent pull-out of brittle phases
Grinding sequence: progressively finer abrasives from 30-micron down to 1-micron diamond suspension
Polishing finish: colloidal silica (0.05-micron) for mirror-like surface free of scratches and smearing
Etching (optional): chemical or electrochemical etchants selected based on material system to reveal grain boundaries and phase structures
What Cross-Section Analysis Reveals
Cross-section analysis is applied to answer specific questions about a component’s internal structure that cannot be answered by surface examination alone.
Coating and plating thickness.
The physical thickness of a coating, plating, or surface treatment layer is directly measurable from the polished cross-section. This is important for quality control of surface treatment processes and for confirming that specified coating thickness requirements have been met. Multiple measurement points across the cross-section reveal thickness uniformity.
Coating adhesion and interface integrity.
The interface between a coating and its substrate, between a plating layer and the base material, or between bonded surfaces can be examined for evidence of voiding, delamination planes, or contaminating films. The locus of a coating adhesion failure, whether the fracture occurred within the coating, at the coating-substrate interface, or within the substrate itself, determines whether the failure was caused by a coating process problem, a surface preparation problem, or a design problem.
Solder joint quality and intermetallic structure.
In PCB and electronics assembly, cross-section analysis reveals the internal structure of solder joints including voids, cracks, the thickness and continuity of intermetallic compound layers, and any evidence of dewetting or non-wetting. For automotive electronics assemblies in Malaysia and Southeast Asia where humid tropical conditions accelerate solder joint degradation, cross-section analysis is a standard tool in reliability assessment and failure investigation.
Crack initiation and propagation paths.
Where a component has fractured or cracked, cross-section through the crack region reveals the crack path through the microstructure. Whether the crack propagates through grains (transgranular) or along grain boundaries (intergranular) provides information about the failure mechanism. The relationship between the crack path and specific microstructural features, such as inclusions, pores, or phase boundaries, identifies the initiation site.
Grain structure and heat treatment effects.
The grain size, grain morphology, and phase distribution visible in an etched cross-section reflect the material’s processing history. Abnormal grain structures, decarburised surface layers, or incorrect phase distributions indicate manufacturing process problems that may contribute to premature failure.
Voids, inclusions, and porosity. Internal defects such as gas porosity, shrinkage voids, and non-metallic inclusions are visible in cross-section even when they do not intersect the surface. The size, distribution, and morphology of these defects provide information about the casting or solidification conditions and can identify initiation sites for fatigue cracks or corrosion. Cross-Section Analysis in Automotive Applications In automotive manufacturing and failure analysis, cross-section analysis is applied across a wide range of component types and failure modes. The following are the most significant application areas. Coated fasteners and body components. Cross-section analysis confirms coating thickness and uniformity for zinc plating, phosphate coating, organic coatings, and multi-layer protective systems on fasteners, brackets, and body components. It identifies delamination planes and contaminating films at coating interfaces where corrosion has initiated. PCB and electronic assembly failure investigation. Solder joint cross-sections reveal the root cause of joint failures in automotive ECUs, sensors, and power modules. For electronics destined for humid tropical markets like Malaysia, cross-section examination of solder joints after accelerated humidity testing is a standard reliability verification step. Hydraulic and powertrain components. Cross-section through precision-machined surfaces reveals surface roughness, residual stress-related features, and the condition of any surface treatment applied to sliding or sealing surfaces. For components that have failed by wear or seizure, cross-section examination of the failed surface reveals the mechanism. Adhesive and bonded joints. Cross-section through a bonded joint or an overmoulded polymer-metal interface reveals the adhesive layer thickness, void content, and the interface condition. For automotive structural adhesives and electronics encapsulation, cross-section analysis is the primary tool for validating bond quality and investigating adhesion failures. Plated and coated component quality. Cross-section analysis confirms plating thickness and uniformity for decorative and functional coatings including zinc, nickel, chromium, and electroless nickel-phosphorus. For multi-layer coating systems, cross-section reveals the thickness of each individual layer and the condition of interfaces between layers. This is critical for components where coating thickness directly affects corrosion resistance or wear performance. How Cross-Section Analysis Fits into a Failure Investigation Cross-section analysis is a destructive technique and is therefore always applied after non-destructive examination is complete. The typical sequence in a failure investigation is as follows. Visual and stereo optical examination first documents the overall condition of the component and identifies the failure site and any obvious features of interest. SEM imaging of the failure site at appropriate magnification characterises the surface morphology and documents the features that will guide cross-section placement. Once the exact cut location is selected based on the surface examination evidence, the cross-section is prepared and examined. Because the act of cutting and polishing permanently alters the sample, the location of the cut must be chosen carefully. A cross-section placed slightly away from the critical feature may miss the most important microstructural evidence. This is why experienced failure analysis teams use the surface examination data to guide cut placement precisely rather than sectioning through the approximate area of interest. For a full explanation of how SEM analysis and EDX contribute to failure investigation before and after cross-section preparation, see our guide on scanning electron microscopy analysis for failure investigation. Integration with other analytical techniques. Cross-section analysis is most powerful when combined with complementary techniques. SEM imaging of the fracture surface before sectioning identifies the failure origin and guides cut placement. EDX analysis of the polished cross-section reveals elemental composition at specific features including coating layers, intermetallic compounds, corrosion products, and contaminating films. For organic materials and polymers, FTIR or Raman spectroscopy identifies resin chemistry and degradation products. Frequently Asked Questions What is the difference between cross-section analysis and microsection analysis?
The two terms describe the same technique. Microsection is the term more commonly used in electronics and PCB analysis contexts, while cross-section is more common in general materials and failure analysis. The preparation process, involving embedding, cutting, grinding, and polishing, is identical. Is cross-section analysis destructive? Yes. Cross-section analysis permanently modifies the sample by cutting through it. This is why it is always performed after non-destructive examination methods have been exhausted and after the analysis team has a clear hypothesis about where to cut and what they are looking for. Can cross-section analysis be combined with SEM and EDX? Yes. The polished cross-section surface is well suited to SEM imaging and EDX elemental analysis. SEM provides high-magnification imaging of microstructural features, coating layers, interfaces, and crack paths. EDX identifies the elemental composition at specific points or areas across the cross-section, including coating composition, contaminating films at interfaces, and corrosion product chemistry. How long does cross-section preparation and analysis take? Sample preparation for a standard cross-section typically takes one to two days. Examination by optical microscopy and SEM-EDX adds additional time depending on the analytical scope. For investigation programmes combining cross-section with other failure analysis techniques, turnaround depends on the full programme. Discuss timing requirements with the laboratory at the enquiry stage. For urgent investigations, some laboratories offer expedited preparation with 24-hour turnaround for standard cross-sections, though this depends on sample complexity and laboratory capacity. Is cross-section analysis used in cleanliness testing? Cross-section preparation is not a standard part of automotive component cleanliness testing under ISO 16232 or VDA 19. However, in cleanliness testing follow-up investigations where particles of unknown origin have been found on filter membranes, cross-section of specific particles can provide information about internal structure and material composition that supports source identification. What standards govern cross-section analysis for PCBs and electronics? IPC-TM-650 2.1.1 defines the standard method for microsectioning of printed boards and electronics assemblies. The standard specifies mounting, grinding, polishing, and etching procedures to produce cross-sections suitable for evaluating plated through-holes, vias, solder joints, and laminate quality. For solder joint assessment, IPC-TM-650 2.4.11 and IPC-A-610 provide acceptance criteria for intermetallic layer thickness, void content, and wetting quality. Next Steps See our full Failure Analysis services including cross-section and microsection analysis Read our guide on scanning electron microscopy analysis for failure investigation Read our guide on PCB cross-section analysis: /blog/pcb-cross-section-analysis/ Contact our team to discuss a cross-section analysis investigation ISO/IEC 17025 Accredited Testing Where Applicable | Cross-Section and Microsection Analysis | Failure Analysis Services Malaysia
Read moreVoids, inclusions, and porosity. Internal defects such as gas porosity, shrinkage voids, and non-metallic inclusions are visible in cross-section even when they do not intersect the surface. The size, distribution, and morphology of these defects provide information about the casting or solidification conditions and can identify initiation sites for fatigue cracks or corrosion. Cross-Section Analysis in Automotive Applications In automotive manufacturing and failure analysis, cross-section analysis is applied across a wide range of component types and failure modes. The following are the most significant application areas. Coated fasteners and body components. Cross-section analysis confirms coating thickness and uniformity for zinc plating, phosphate coating, organic coatings, and multi-layer protective systems on fasteners, brackets, and body components. It identifies delamination planes and contaminating films at coating interfaces where corrosion has initiated. PCB and electronic assembly failure investigation. Solder joint cross-sections reveal the root cause of joint failures in automotive ECUs, sensors, and power modules. For electronics destined for humid tropical markets like Malaysia, cross-section examination of solder joints after accelerated humidity testing is a standard reliability verification step. Hydraulic and powertrain components. Cross-section through precision-machined surfaces reveals surface roughness, residual stress-related features, and the condition of any surface treatment applied to sliding or sealing surfaces. For components that have failed by wear or seizure, cross-section examination of the failed surface reveals the mechanism. Adhesive and bonded joints. Cross-section through a bonded joint or an overmoulded polymer-metal interface reveals the adhesive layer thickness, void content, and the interface condition. For automotive structural adhesives and electronics encapsulation, cross-section analysis is the primary tool for validating bond quality and investigating adhesion failures. Plated and coated component quality. Cross-section analysis confirms plating thickness and uniformity for decorative and functional coatings including zinc, nickel, chromium, and electroless nickel-phosphorus. For multi-layer coating systems, cross-section reveals the thickness of each individual layer and the condition of interfaces between layers. This is critical for components where coating thickness directly affects corrosion resistance or wear performance. How Cross-Section Analysis Fits into a Failure Investigation Cross-section analysis is a destructive technique and is therefore always applied after non-destructive examination is complete. The typical sequence in a failure investigation is as follows. Visual and stereo optical examination first documents the overall condition of the component and identifies the failure site and any obvious features of interest. SEM imaging of the failure site at appropriate magnification characterises the surface morphology and documents the features that will guide cross-section placement. Once the exact cut location is selected based on the surface examination evidence, the cross-section is prepared and examined. Because the act of cutting and polishing permanently alters the sample, the location of the cut must be chosen carefully. A cross-section placed slightly away from the critical feature may miss the most important microstructural evidence. This is why experienced failure analysis teams use the surface examination data to guide cut placement precisely rather than sectioning through the approximate area of interest. For a full explanation of how SEM analysis and EDX contribute to failure investigation before and after cross-section preparation, see our guide on scanning electron microscopy analysis for failure investigation. Integration with other analytical techniques. Cross-section analysis is most powerful when combined with complementary techniques. SEM imaging of the fracture surface before sectioning identifies the failure origin and guides cut placement. EDX analysis of the polished cross-section reveals elemental composition at specific features including coating layers, intermetallic compounds, corrosion products, and contaminating films. For organic materials and polymers, FTIR or Raman spectroscopy identifies resin chemistry and degradation products. Frequently Asked Questions What is the difference between cross-section analysis and microsection analysis?
The two terms describe the same technique. Microsection is the term more commonly used in electronics and PCB analysis contexts, while cross-section is more common in general materials and failure analysis. The preparation process, involving embedding, cutting, grinding, and polishing, is identical. Is cross-section analysis destructive? Yes. Cross-section analysis permanently modifies the sample by cutting through it. This is why it is always performed after non-destructive examination methods have been exhausted and after the analysis team has a clear hypothesis about where to cut and what they are looking for. Can cross-section analysis be combined with SEM and EDX? Yes. The polished cross-section surface is well suited to SEM imaging and EDX elemental analysis. SEM provides high-magnification imaging of microstructural features, coating layers, interfaces, and crack paths. EDX identifies the elemental composition at specific points or areas across the cross-section, including coating composition, contaminating films at interfaces, and corrosion product chemistry. How long does cross-section preparation and analysis take? Sample preparation for a standard cross-section typically takes one to two days. Examination by optical microscopy and SEM-EDX adds additional time depending on the analytical scope. For investigation programmes combining cross-section with other failure analysis techniques, turnaround depends on the full programme. Discuss timing requirements with the laboratory at the enquiry stage. For urgent investigations, some laboratories offer expedited preparation with 24-hour turnaround for standard cross-sections, though this depends on sample complexity and laboratory capacity. Is cross-section analysis used in cleanliness testing? Cross-section preparation is not a standard part of automotive component cleanliness testing under ISO 16232 or VDA 19. However, in cleanliness testing follow-up investigations where particles of unknown origin have been found on filter membranes, cross-section of specific particles can provide information about internal structure and material composition that supports source identification. What standards govern cross-section analysis for PCBs and electronics? IPC-TM-650 2.1.1 defines the standard method for microsectioning of printed boards and electronics assemblies. The standard specifies mounting, grinding, polishing, and etching procedures to produce cross-sections suitable for evaluating plated through-holes, vias, solder joints, and laminate quality. For solder joint assessment, IPC-TM-650 2.4.11 and IPC-A-610 provide acceptance criteria for intermetallic layer thickness, void content, and wetting quality. Next Steps See our full Failure Analysis services including cross-section and microsection analysis Read our guide on scanning electron microscopy analysis for failure investigation Read our guide on PCB cross-section analysis: /blog/pcb-cross-section-analysis/ Contact our team to discuss a cross-section analysis investigation ISO/IEC 17025 Accredited Testing Where Applicable | Cross-Section and Microsection Analysis | Failure Analysis Services Malaysia
October 12, 2026
Neutral Salt Spray · Acetic Acid Salt Spray · CASS · Cyclic Corrosion · Standard Selection Guide
ISO/IEC 17025 Accredited Testing Where Applicable | Salt Spray and Corrosion Testing Capability | Automotive Materials Testing Malaysia
Salt spray testing is one of the most widely specified corrosion tests in automotive manufacturing. It provides a controlled, accelerated corrosive environment that allows coatings, platings, and surface treatments to be evaluated against defined acceptance criteria within days rather than years. What is less straightforward is which standard to test to, because several different standards govern salt spray testing, and they are not all equivalent.
For automotive manufacturers and component suppliers in Malaysia and Southeast Asia working across Japanese, European, American, and global supply chains, knowing the difference between ISO 9227, ASTM B117, JASO M609, and DIN 50021 is practical knowledge that prevents mistakes at the specification stage and avoids retesting when a submission is rejected for referencing the wrong standard.
What Is a Salt Spray Test
A salt spray test, also called a salt fog test, exposes a specimen to a continuously atomised salt solution inside a controlled chamber under defined temperature conditions. The purpose is to accelerate the corrosion processes that would develop over much longer periods under real environmental exposure, allowing manufacturers to evaluate corrosion protection performance in a practical timeframe.
The result of a salt spray test is an assessment of the specimen’s condition after a defined exposure period, typically evaluated by visual inspection for corrosion products, blistering, coating breakdown, and corrosion creep from any scribed lines cut into the coating before exposure. The result is compared against the acceptance criteria defined in the applicable specification.
Salt spray testing does not directly simulate specific years of real-world service life. Test hours should not be converted to service years. The test is a comparative and qualification tool, not a life prediction method.
ISO 9227, The International Standard
ISO 9227 is the primary international standard for salt spray corrosion testing. It defines three test atmospheres, each suited to different material and coating types.
Atmosphere
Abbreviation
Test conditions
Typical application
Neutral Salt Spray
NSS
5% NaCl solution, 35°C
General corrosion testing for metallic materials with or without corrosion protection
Acetic Acid Salt Spray
AASS
5% NaCl with acetic acid, 35°C
Decorative coatings, anodised aluminium, specific plating systems where specified
Copper Accelerated Acetic Acid Salt Spray
CASS
5% NaCl with acetic acid and copper chloride, 50°C
Decorative copper-nickel-chromium or nickel-chromium coating systems where specified
ISO 9227 is referenced by European OEM specifications and most global OEM material standards. It is the standard most commonly encountered by automotive suppliers in Malaysia serving European or broadly international supply chains.
The NSS atmosphere is by far the most widely used. AASS and CASS are applied only when the applicable specification specifically calls for them. Using AASS or CASS when NSS is required, or vice versa, is a test method non-conformance that invalidates the result.
ISO 9227:2022 Revision
The most recent revision of ISO 9227 was published in 2022, updating the previous 2017 version. The 2022 revision clarifies requirements for chamber calibration, fog collection measurement, and specimen positioning, but the fundamental test conditions for NSS, AASS, and CASS remain unchanged. Laboratories accredited to ISO/IEC 17025 should ensure their procedures reference the current version unless the customer specification explicitly names an earlier edition.
ASTM B117, The American Standard
ASTM B117 is published by ASTM International and is titled Standard Practice for Operating Salt Spray (Fog) Apparatus. It specifies the neutral salt spray atmosphere using a 5% sodium chloride solution at 35°C, which is directly comparable to the NSS atmosphere defined in ISO 9227.
The important distinction is that ASTM B117 covers only the neutral salt spray atmosphere. It does not include AASS or CASS equivalents within the same standard. When a North American OEM specification references ASTM B117, it is specifying neutral salt spray only.
For automotive suppliers in Malaysia receiving drawings from North American OEMs or their Tier-1 suppliers, ASTM B117 is the corrosion test reference most commonly encountered. The underlying test conditions match ISO 9227 NSS, but the report must reference the correct standard as named in the specification.
ASTM B117 vs ISO 9227 NSS: Key Parameters
Parameter
ASTM B117
ISO 9227 NSS
Salt solution
5% NaCl by mass
50 ± 5 g/L (approximately 5%)
Temperature
35 ± 2°C
35 ± 2°C
Solution pH
6.5 – 7.2
6.5 – 7.2
Fog collection rate
1 – 2 mL per 80 cm² per hour
1 – 2 mL per 80 cm² per hour
Chamber volume
Not specified
Minimum 0.4 m³ recommended
The test conditions are functionally equivalent for neutral salt spray. The report must reference the standard named in the specification, even though the underlying conditions match.
Related Standard: ASTM G85
While ASTM B117 covers neutral salt spray only, ASTM G85 (Standard Practice for Modified Salt Spray Testing) defines additional corrosive environments including acetic acid salt spray and copper-accelerated tests that are broadly comparable to ISO 9227 AASS and CASS. Some North American OEM specifications reference ASTM G85 annexes rather than ASTM B117 when acidic or accelerated atmospheres are required.
JASO M609, The Japanese Automotive Standard
JASO M609 is published by the Society of Automotive Engineers of Japan (JSAE) and defines a cyclic corrosion test method widely used by Japanese OEMs including Toyota, Honda, and Nissan.
Unlike ISO 9227 and ASTM B117, which specify continuous salt spray exposure, JASO M609 defines a cyclic test protocol that alternates between salt spray exposure, drying at elevated temperature, and humid conditions. This cyclic approach is designed to better represent the wet-dry cycle experienced by vehicle components in real service conditions, particularly in the Japanese and East Asian markets where vehicle corrosion performance was historically a key quality differentiator.
JASO M609 is not a direct substitute for ISO 9227 NSS or ASTM B117. Continuous salt spray and cyclic corrosion produce different corrosion morphologies and cannot be directly compared in terms of hours of exposure. Suppliers serving Japanese OEM supply chains in Malaysia should confirm whether JASO M609 or a derivative Japanese OEM protocol is specified before selecting a test method.
JASO M609:2024 Update
JASO M609 was comprehensively revised in 2024, replacing the 1991 version that had been in use for over three decades. The 2024 revision defines three test methods: Method A for cosmetic corrosion evaluation, Method B for perforation corrosion assessment, and Method C for combined evaluation. The cyclic protocol typically alternates between salt spray, controlled drying at elevated temperature, and high-humidity conditioning over a repeating cycle. Because the 2024 revision is a major update, suppliers should confirm with Japanese OEMs which version applies to their programme.
DIN 50021, The German Standard and Its Relationship to ISO 9227
DIN 50021 is a German standard that historically specified salt spray testing before the equivalent ISO standard was established. It is now largely superseded by ISO 9227 for most applications, and most German OEM specifications that previously referenced DIN 50021 have transitioned to ISO 9227.
Where DIN 50021 still appears in older component drawings or legacy specifications that have not been updated, it is generally treated as equivalent to ISO 9227 NSS for the neutral salt spray atmosphere. However, if a specification explicitly references DIN 50021, the laboratory should document the applicable standard correctly on the test report. Substituting ISO 9227 without confirming equivalence with the customer is not recommended.
How to Choose the Right Standard
The correct standard for a salt spray test is always determined by the component drawing, material specification, or OEM quality requirement, not by the laboratory or the supplier. The decision tree is straightforward.
If the specification references ISO 9227, identify which atmosphere is required: NSS, AASS, or CASS
If the specification references ASTM B117, the test is neutral salt spray to the American standard
If the specification references JASO M609 or a Japanese OEM cyclic protocol, the test is a cyclic corrosion test, not continuous salt spray
If the specification references DIN 50021, confirm with the customer whether ISO 9227 NSS is accepted as equivalent before testing
For suppliers in Malaysia receiving components from multiple OEM relationships, it is common to encounter two or more of these standards across different programmes. Each specification must be addressed individually. Do not assume that meeting one standard automatically satisfies another.
What the Standards Have in Common
Despite their differences in origin, scope, and test atmosphere, all four standards share certain fundamental characteristics.
Test duration is defined by the specification.
Exposure periods ranging from 96 hours for basic coating qualification to 1,000 hours or more for demanding exterior and underbody applications are all valid, depending on what the specification requires. Acceptance criteria are defined by the specification.
Results are interpreted against a specific pass or fail criterion, whether that is maximum corrosion creep from a scribe line, maximum percentage of surface showing corrosion, or a visual rating against a defined photographic standard. Specimen preparation and positioning affect results.
All four standards specify requirements for cleaning before testing, positioning in the chamber (typically at 15 to 30 degrees from vertical), and handling to prevent contamination. Deviations can invalidate the test result. Test reports must state key parameters.
All four standards require the report to state the standard used, the test atmosphere, the exposure duration, and the chamber conditions, alongside the specimen description, inspection observations, and pass or fail conclusion. Frequently Asked Questions What is the difference between ISO 9227 and ASTM B117?
ISO 9227 defines three test atmospheres: NSS, AASS, and CASS. ASTM B117 covers neutral salt spray only. The NSS conditions in both standards are equivalent in terms of salt concentration and test temperature. The report must reference the standard named in the specification. What is JASO M609 and how does it differ from ISO 9227?
JASO M609 is a Japanese automotive cyclic corrosion test that alternates between salt spray, drying, and humidity phases. ISO 9227 specifies continuous salt spray exposure. The two methods produce different corrosion patterns and are not interchangeable. Cyclic corrosion test results and continuous salt spray results should not be compared directly. Is DIN 50021 still used in automotive specifications in Malaysia?
DIN 50021 appears occasionally in older drawings and legacy specifications that have not been updated to reference ISO 9227. For most practical purposes it is treated as equivalent to ISO 9227 NSS, but confirm equivalence with the customer before substituting one for the other on a test report. How many hours of salt spray testing does my component need?
The required exposure duration is defined by the component specification, not by the laboratory. Basic coating qualification tests may run from 96 to 240 hours. More demanding exterior or underbody requirements typically specify 500 to 1,000 hours or more. Confirm the required duration with the specification before testing begins. Can salt spray test hours be converted into years of service life?
No. Salt spray testing is an accelerated comparative method, not a direct simulation of field exposure. The relationship between test hours and service life depends on the specific coating, the operating environment, and other factors that salt spray testing does not replicate. What acceptance criteria are commonly used for salt spray testing in automotive applications? Acceptance criteria are defined by the component specification. Common criteria include maximum corrosion creep from a scribed line (typically 1 mm to 5 mm), maximum percentage surface corrosion (often 5% to 10% for exterior components), or rating against photographic standards such as ISO 10289 or ASTM D1654. Basic coating qualification tests typically run 96 to 240 hours. Exterior body panels and trim commonly require 500 to 1,000 hours. Underbody and chassis components may specify 1,000 hours or more. Next Steps See our full Materials and Environmental Testing services for automotive corrosion testing Read our detailed guide on ISO 9227 vs ASTM B117 salt spray testing Read our guide on accelerated aging and environmental simulation testing: /blog/accelerated-aging-environmental-simulation/ Contact our team for a corrosion testing quotation or technical discussion ISO/IEC 17025 Accredited Testing Where Applicable | Salt Spray and Cyclic Corrosion Testing | Automotive Corrosion Testing Malaysia
Read moreExposure periods ranging from 96 hours for basic coating qualification to 1,000 hours or more for demanding exterior and underbody applications are all valid, depending on what the specification requires. Acceptance criteria are defined by the specification.
Results are interpreted against a specific pass or fail criterion, whether that is maximum corrosion creep from a scribe line, maximum percentage of surface showing corrosion, or a visual rating against a defined photographic standard. Specimen preparation and positioning affect results.
All four standards specify requirements for cleaning before testing, positioning in the chamber (typically at 15 to 30 degrees from vertical), and handling to prevent contamination. Deviations can invalidate the test result. Test reports must state key parameters.
All four standards require the report to state the standard used, the test atmosphere, the exposure duration, and the chamber conditions, alongside the specimen description, inspection observations, and pass or fail conclusion. Frequently Asked Questions What is the difference between ISO 9227 and ASTM B117?
ISO 9227 defines three test atmospheres: NSS, AASS, and CASS. ASTM B117 covers neutral salt spray only. The NSS conditions in both standards are equivalent in terms of salt concentration and test temperature. The report must reference the standard named in the specification. What is JASO M609 and how does it differ from ISO 9227?
JASO M609 is a Japanese automotive cyclic corrosion test that alternates between salt spray, drying, and humidity phases. ISO 9227 specifies continuous salt spray exposure. The two methods produce different corrosion patterns and are not interchangeable. Cyclic corrosion test results and continuous salt spray results should not be compared directly. Is DIN 50021 still used in automotive specifications in Malaysia?
DIN 50021 appears occasionally in older drawings and legacy specifications that have not been updated to reference ISO 9227. For most practical purposes it is treated as equivalent to ISO 9227 NSS, but confirm equivalence with the customer before substituting one for the other on a test report. How many hours of salt spray testing does my component need?
The required exposure duration is defined by the component specification, not by the laboratory. Basic coating qualification tests may run from 96 to 240 hours. More demanding exterior or underbody requirements typically specify 500 to 1,000 hours or more. Confirm the required duration with the specification before testing begins. Can salt spray test hours be converted into years of service life?
No. Salt spray testing is an accelerated comparative method, not a direct simulation of field exposure. The relationship between test hours and service life depends on the specific coating, the operating environment, and other factors that salt spray testing does not replicate. What acceptance criteria are commonly used for salt spray testing in automotive applications? Acceptance criteria are defined by the component specification. Common criteria include maximum corrosion creep from a scribed line (typically 1 mm to 5 mm), maximum percentage surface corrosion (often 5% to 10% for exterior components), or rating against photographic standards such as ISO 10289 or ASTM D1654. Basic coating qualification tests typically run 96 to 240 hours. Exterior body panels and trim commonly require 500 to 1,000 hours. Underbody and chassis components may specify 1,000 hours or more. Next Steps See our full Materials and Environmental Testing services for automotive corrosion testing Read our detailed guide on ISO 9227 vs ASTM B117 salt spray testing Read our guide on accelerated aging and environmental simulation testing: /blog/accelerated-aging-environmental-simulation/ Contact our team for a corrosion testing quotation or technical discussion ISO/IEC 17025 Accredited Testing Where Applicable | Salt Spray and Cyclic Corrosion Testing | Automotive Corrosion Testing Malaysia
October 12, 2026
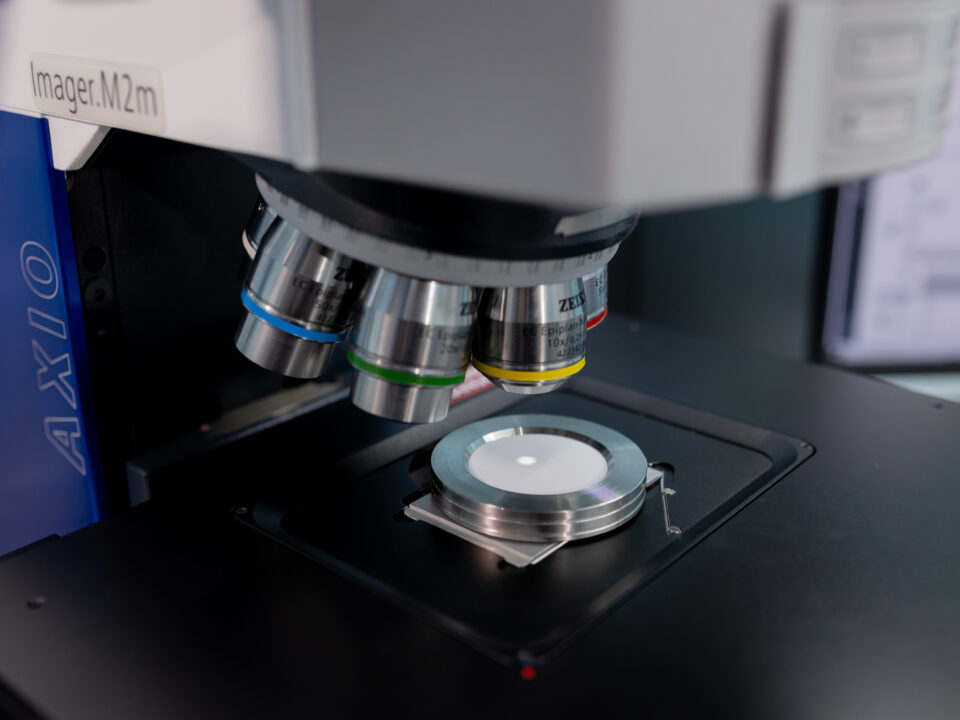
Gravimetric vs Microscopic Particle Analysis, Which Method Is Right for Your Application
Gravimetric Analysis · Microscopic Particle Count · LPC · ISO 16232 · VDA 19 · Cleanliness Classification
ISO/IEC 17025 Accredited Testing Where Applicable | Full Particle Analysis Capability | Technical Cleanliness Specialist Malaysia
When a component is submitted for cleanliness testing under ISO 16232 or VDA 19, the test programme does not choose between gravimetric analysis and microscopic particle analysis. Both are required. But understanding what each method measures, why each exists, and what each one can and cannot tell you helps manufacturers in Malaysia and across Southeast Asia prepare better samples, interpret results more accurately, and make better decisions when a component is close to its specification limit.
What Is Gravimetric Analysis
Gravimetric analysis is the measurement of total particle mass collected from a component surface during cleanliness testing. After particles are extracted from the component using a validated extraction method and filtered onto a membrane, the membrane is dried and weighed on a calibrated analytical balance before and after filtration. The difference in mass is the gravimetric result, expressed in milligrams per defined surface area of the component, typically milligrams per 1,000 square centimetres.
Gravimetric analysis gives a single number representing the total mass of all extracted contamination. It does not distinguish between one large particle and thousands of small ones of equivalent total mass. It does not identify particle types or measure individual particle sizes. What it provides is a fast, reproducible, and defensible measure of overall contamination load that can be compared directly against a gravimetric cleanliness limit where one is specified.
Key Characteristics
Fast and reproducible: results available within hours of filtration
Integral measurement: cannot distinguish between one large particle and thousands of small ones of equivalent mass
Minimum detectable mass: typically 1 mg under controlled conditions; 3 mg or more recommended under non-climate-controlled environments per VDA 19 and ISO 16232 guidance
Expressed as: mg per component or mg per 1,000 cm² of wetted surface area
What Is Microscopic Particle Analysis
Microscopic particle analysis examines the particles collected on the filter membrane under a calibrated microscope, counting and measuring each particle individually and classifying it by type. The analysis produces a particle size distribution: how many particles were found in each defined size range, from the smallest detectable size up to particles larger than 1,000 micrometres. It also classifies each particle into one of the categories defined by ISO 16232 and VDA 19.
Particle category
Description
Metallic shiny
Highly reflective particles consistent with machined metal debris or wear particles
Metallic non-shiny
Oxide-coated or corroded metal particles
Fibre
Elongated particles with length-to-width ratio greater than ten
Other non-metallic
Rubber, polymer, ceramic, mineral debris
This classification matters because OEM cleanliness specifications often apply different limits to different particle types. A single metallic shiny particle above a critical size threshold is often treated as a non-conformance regardless of the total count, because metallic debris carries a higher risk of causing mechanical damage in precision assemblies.
Automated vs Manual Classification
Microscopic analysis can be performed manually by an operator viewing the filter membrane under an optical microscope, or by automated image analysis systems that capture and classify particles using software algorithms. Automated systems improve throughput and reduce operator variability, but manual review is still required for borderline cases and for confirming particle classification when the specification applies different limits to different particle types.
How Gravimetric and Microscopic Analysis Compare
Dimension
Gravimetric Analysis
Microscopic Particle Analysis
What it measures
Total mass of all extracted particles
Individual particle count by size class and type
Output
mg per 1,000 cm²
Particles per size class per 1,000 cm²
Speed
Fast
Slower, especially for high particle counts
Particle type information
None
Yes, by visual classification
Size distribution
None
Full distribution across defined size classes
Identifies single large particles
No
Yes
Required by ISO 16232 and VDA 19
Yes
Yes
The key limitation of gravimetric analysis is that it cannot identify a single oversized particle. A component could show a very low gravimetric result while still containing one metallic shiny particle large enough to jam a hydraulic valve or score a fuel injector. Microscopic analysis catches this scenario. The key limitation of microscopic analysis is that it does not capture particles smaller than the lower size threshold of the analysis, and the total contamination mass is not directly available from a particle count alone.
Light Obscuration Particle Counting (LPC) and Its Role
In addition to manual or automated microscopic analysis, ISO 16232 and VDA 19 include light obscuration particle counting (LPC) as the method used to generate the formal cleanliness classification. LPC re-suspends the extracted particles in a clean solvent and passes the suspension through a laser-based counting instrument, which counts and sizes each particle automatically as it passes through the measurement cell.
LPC is faster and more statistically representative than manual microscopic counting for high particle counts, and it is the method that generates the Component Cleanliness Code (CCC) used in formal OEM reporting. For a detailed explanation of how LPC works and where it fits in the cleanliness testing workflow, see our guide on Liquid-Borne Particle Count testing.
LPC vs Optical Microscopy
LPC measures particle size based on the shadow cast by each particle as it passes through the laser beam, reporting an equivalent spherical diameter. Optical microscopy measures the actual two-dimensional dimensions of each particle on the filter membrane. For irregularly shaped particles, the two methods may report different sizes for the same particle. LPC is the method that generates the Component Cleanliness Code (CCC) for formal reporting under ISO 16232-10, while optical microscopy provides particle type classification that LPC cannot deliver.
When Both Methods Are Needed Together
Under ISO 16232 and VDA 19, gravimetric analysis and microscopic particle analysis (including LPC) are not alternatives. They are complementary and both are required as part of a complete cleanliness test.
Gravimetric analysis provides the overall contamination mass, which is compared against the gravimetric limit where one is specified. Microscopic analysis and LPC provide the size distribution and type classification, which are compared against the size-class particle count limits defined in the OEM specification. A component that passes the gravimetric limit may still fail the particle count limit in a specific size class, and vice versa. A complete cleanliness test result requires both.
For automotive suppliers in Malaysia and Southeast Asia submitting components for OEM qualification, the test report must include both gravimetric and particle count results in the format required by the applicable standard, whether ISO 16232 or VDA 19, and formatted to the specific OEM reporting template where one is defined.
Reporting Format
Under ISO 16232-10, the complete test result includes the gravimetric residue weight (mg), the particle count distribution by size class (particles per 1,000 cm²), and the Component Cleanliness Code (CCC) derived from the LPC data. The CCC is written as a sequence of alphanumerical pairs enclosed in parentheses and separated by slashes, specifying the contamination level for each size class. VDA 19 uses a similar reporting structure with minor differences in notation.
Practical Guidance for Manufacturers in Malaysia
Automotive component manufacturers in Malaysia working with Japanese, European, or American OEM supply chains frequently encounter cleanliness requirements referencing ISO 16232 or VDA 19. Understanding how these two measurement methods work helps in several practical ways.
When a component is close to its particle count limit in a specific size class
The microscopic classification results often provide clues about the contamination source. A high count of metallic shiny particles in the 50 to 100 micrometre size class is more likely to point toward a machining or grinding process than toward packaging or handling. When gravimetric results are inconsistent with particle counts
Investigate the particle size distribution and morphology. A high gravimetric result with low particle counts may indicate a large mass of very fine particles below the LPC lower size threshold, or soluble residues that contribute to mass but not to particle count. A low gravimetric result with high particle counts suggests many small particles with low individual mass. When a component shows an elevated gravimetric result but passes all particle count limits
The discrepancy may indicate particles that dissolve partially into the extraction solvent and contribute to the gravimetric mass without appearing in the microscopic count. This scenario has different implications for corrective action than a high particle count with low gravimetric mass. Frequently Asked Questions What is the difference between gravimetric analysis and particle counting in cleanliness testing? Gravimetric analysis measures the total mass of all extracted particles. Particle counting measures the number of individual particles in each size class. Both are required under ISO 16232 and VDA 19 and answer different questions about the same contamination. Can gravimetric analysis alone determine whether a component passes its cleanliness specification? Not in most cases. Most OEM cleanliness specifications define both a gravimetric limit and particle count limits by size class. A component must meet both to pass. Gravimetric analysis alone cannot confirm compliance with the particle count limits. What is particle size analysis in the context of automotive cleanliness testing? Particle size analysis refers to the process of counting and sizing individual particles extracted from a component, producing a size distribution that shows how many particles were found in each defined size range. In automotive cleanliness testing, this is performed by automated microscopic analysis or LPC and is the basis for the cleanliness classification reported in the test result. Is accredited testing required for OEM cleanliness submissions in Malaysia? For formal OEM qualification and supply chain submissions, test results are typically required from a laboratory accredited to ISO/IEC 17025 by an ILAC MRA recognised accreditation body. ALS Testing in Malaysia provides cleanliness testing under ISO/IEC 17025 accreditation. Confirm the specific accreditation requirement with your OEM or customer before submitting. What is the minimum gravimetric residue that can be reliably measured? Under climate-controlled laboratory conditions, gravimetric analysis can reliably detect residue masses down to approximately 1 mg. VDA 19 and ISO 16232 guidance recommends a minimum of 3 mg for non-climate-controlled environments to account for environmental variability. For components with very low expected contamination, the gravimetric result may be reported as “below detection limit” or “< 1 mg” depending on the laboratory’s balance sensitivity and environmental controls. Next Steps See our full Technical Cleanliness Testing services for ISO 16232 and VDA 19 Read our guide on particle analysis methods, standards and applications Read our guide on Liquid-Borne Particle Count testing Contact our team for a cleanliness testing quotation or technical discussion ISO/IEC 17025 Accredited Testing Where Applicable | Gravimetric and Microscopic Particle Analysis | Technical Cleanliness Testing Malaysia
Read moreThe microscopic classification results often provide clues about the contamination source. A high count of metallic shiny particles in the 50 to 100 micrometre size class is more likely to point toward a machining or grinding process than toward packaging or handling. When gravimetric results are inconsistent with particle counts
Investigate the particle size distribution and morphology. A high gravimetric result with low particle counts may indicate a large mass of very fine particles below the LPC lower size threshold, or soluble residues that contribute to mass but not to particle count. A low gravimetric result with high particle counts suggests many small particles with low individual mass. When a component shows an elevated gravimetric result but passes all particle count limits
The discrepancy may indicate particles that dissolve partially into the extraction solvent and contribute to the gravimetric mass without appearing in the microscopic count. This scenario has different implications for corrective action than a high particle count with low gravimetric mass. Frequently Asked Questions What is the difference between gravimetric analysis and particle counting in cleanliness testing? Gravimetric analysis measures the total mass of all extracted particles. Particle counting measures the number of individual particles in each size class. Both are required under ISO 16232 and VDA 19 and answer different questions about the same contamination. Can gravimetric analysis alone determine whether a component passes its cleanliness specification? Not in most cases. Most OEM cleanliness specifications define both a gravimetric limit and particle count limits by size class. A component must meet both to pass. Gravimetric analysis alone cannot confirm compliance with the particle count limits. What is particle size analysis in the context of automotive cleanliness testing? Particle size analysis refers to the process of counting and sizing individual particles extracted from a component, producing a size distribution that shows how many particles were found in each defined size range. In automotive cleanliness testing, this is performed by automated microscopic analysis or LPC and is the basis for the cleanliness classification reported in the test result. Is accredited testing required for OEM cleanliness submissions in Malaysia? For formal OEM qualification and supply chain submissions, test results are typically required from a laboratory accredited to ISO/IEC 17025 by an ILAC MRA recognised accreditation body. ALS Testing in Malaysia provides cleanliness testing under ISO/IEC 17025 accreditation. Confirm the specific accreditation requirement with your OEM or customer before submitting. What is the minimum gravimetric residue that can be reliably measured? Under climate-controlled laboratory conditions, gravimetric analysis can reliably detect residue masses down to approximately 1 mg. VDA 19 and ISO 16232 guidance recommends a minimum of 3 mg for non-climate-controlled environments to account for environmental variability. For components with very low expected contamination, the gravimetric result may be reported as “below detection limit” or “< 1 mg” depending on the laboratory’s balance sensitivity and environmental controls. Next Steps See our full Technical Cleanliness Testing services for ISO 16232 and VDA 19 Read our guide on particle analysis methods, standards and applications Read our guide on Liquid-Borne Particle Count testing Contact our team for a cleanliness testing quotation or technical discussion ISO/IEC 17025 Accredited Testing Where Applicable | Gravimetric and Microscopic Particle Analysis | Technical Cleanliness Testing Malaysia
October 8, 2026
ESG—Environmental, Social, and Governance—is a framework for assessing an organisation’s sustainability performance, with increasing emphasis on environmental, social, and governance data. Many industrial organisations are therefore required to prepare reports and disclose information that can be independently verified.
One important environmental indicator is volatile organic compounds (VOCs), which are directly associated with air quality, worker health, and emissions control.
The Role of Volatile Organic Compounds (VOCs) in the ESG Context
Volatile organic compounds (VOCs) are a group of chemicals that evaporate readily at room temperature. They can be found in manufacturing processes, fuel combustion, and a wide range of industrial activities.
VOC emissions may affect both air quality and workers’ health. In the context of ESG, VOCs are relevant to all three dimensions:
Environmental: Monitoring VOC levels reflects the effectiveness of an organisation’s emissions-control measures.
Social: VOC management is associated with occupational health and worker safety.
Governance: Accurate and verifiable VOC reporting demonstrates organisational transparency.
VOC data therefore represents more than technical concentration measurements. It forms part of the overall assessment of an organisation’s sustainability and corporate responsibility.
The Importance of Accuracy in VOC Analysis
Assessing VOC levels requires both appropriate sampling and accurate analysis. Portable instruments such as photoionisation detectors (PIDs) can rapidly screen overall VOC levels. However, identifying specific compounds and producing formal analytical reports requires laboratory analysis.
Technologies commonly used for VOC analysis include:
GC-MS (Gas Chromatography–Mass Spectrometry): Used to separate and accurately identify individual compounds.
HSGC (Headspace Gas Chromatography): Used to analyse VOCs in water.
SPE (Solid-Phase Extraction): Used to prepare soil and water samples before analysis.
The accuracy of analytical results does not depend solely on the instruments used. It also depends on sampling and sample-preservation procedures, as well as the laboratory’s quality-control system. If these processes are inappropriate, the results may be inaccurate and could affect risk assessments.
In the ESG context, data used in reporting should be traceable and sufficiently reliable to be accepted both domestically and internationally.
VOC Analysis in Air, Water, and Soil
VOCs can be present in various environmental media. The analytical approach must therefore be selected according to the characteristics of each sample type.
VOC Analysis in Air
Air samples may be collected using sorbent-based methods or continuous sampling techniques. The samples are subsequently analysed using GC-MS to identify and quantify the compounds present.
Assessing VOC levels in air is important for controlling air quality in workplaces and industrial areas.
VOC Analysis in Water
Because VOCs evaporate easily, water samples must be collected in tightly sealed containers, with precautions taken to minimise losses during transportation.
HSGC may be used in combination with GC-MS to obtain accurate results. The data is important for assessing water quality and determining whether water is safe for consumption or other intended uses.
VOC Analysis in Soil
At sites with a history of contamination from industrial activities, collecting soil samples from multiple locations helps provide comprehensive information.
Soil samples are commonly prepared using SPE before being analysed by GC-MS. The analytical results can be used to assess long-term environmental and health risks.
Verifiable Data and the Laboratory’s Role in the ESG Context
Under the ESG framework—particularly the Environmental and Governance dimensions—environmental data must be accurate and traceable. Laboratories therefore play an important role in ensuring that VOC analysis results are reliable.
Quality control, instrument calibration, and systematic documentation help ensure that analytical results can be used transparently for:
ESG and sustainability reporting
Submissions to regulatory authorities
Communication with stakeholders
In the ESG context, analytical figures are therefore more than concentration values. They are evidence of an organisation’s responsibility, transparency, and commitment to sustainability.
For more information: https://www.alstesting.co.th/volatile-organic-compounds-vocs/
Read moreOctober 8, 2026
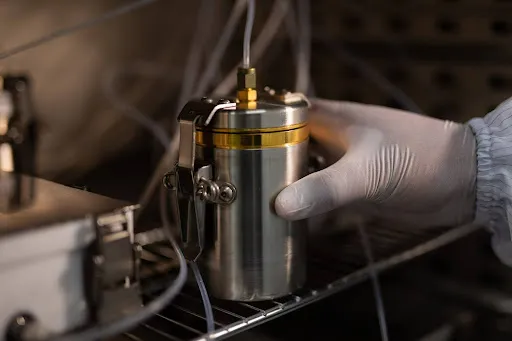
Ensuring Product Quality and Safety Through GC-MS Analysis
In an era when quality control and product safety are essential for every business, accurate and comprehensive chemical analysis techniques such as GC-MS (Gas Chromatography–Mass Spectrometry) have become important tools that help businesses ensure the quality and safety of their products.
In this article, we introduce GC-MS and explain why businesses across various industries—particularly the food industry—should place importance on this type of testing. We also introduce GC-MS testing services from ALS Testing Services (Thailand), which supports businesses with advanced technology and internationally recognised expertise.
The Four-Step GC-MS Testing Process for Product Quality and Safety
GC-MS is a chemical analysis technique that combines two analytical instruments:
GC (Gas Chromatography): Separates the different compounds in a sample into individual components
MS (Mass Spectrometry): Analyses and identifies each compound by measuring its mass and chemical structure
This technique enables compounds in a sample to be identified and quantified in a detailed, accurate, and rapid manner.
1. Sample Injection
The first step is to prepare and inject the sample into the GC instrument. In general, the sample is prepared in liquid or gaseous form and then injected into the system using an automated injector that precisely controls the sample volume.
The carrier gas transports the sample into the separation column. Temperature and pressure are carefully controlled during this stage to preserve the integrity of the sample and ensure accurate analytical results.
2. Separation of Compounds
Once the sample enters the separation column, it passes through a specialised coating inside a very long and narrow tube. A carrier gas helps move the compounds through the column.
Because different compounds interact differently with the column surface and have different boiling points, they travel through the column at different rates and are separated from one another.
This process is similar to filtering a mixture into its individual components, allowing each substance to be accurately analysed in the next stage.
3. Detection of Compounds
After the compounds have been separated in the GC column, they are transferred to the MS instrument. The MS converts the molecules into ions through an ionisation process using electrical energy or light.
The instrument then measures the mass of each ion by separating them according to their mass-to-charge ratio.
4. Data Analysis and Compound Identification
The results from the MS instrument are converted into a mass spectrum, which shows the distribution of ions according to their mass and signal intensity.
Data-analysis software compares this spectrum with standard databases containing the mass signatures of numerous chemical substances. This enables the compounds present in the sample to be identified.
The concentration of each compound can also be accurately calculated based on the intensity of the detected signal. This information is essential for evaluating product quality and safety.
The Importance of GC-MS Analysis
GC-MS plays an important role in many industries, including food and beverages, pharmaceuticals, environmental testing, and chemical manufacturing.
It enables businesses to effectively monitor and control product quality, prevent risks associated with residues or hazardous substances, and comply with stringent legal requirements and international standards.
Detailed Analysis of Chemicals and Contaminants
GC-MS can detect a wide range of complex organic compounds at very low concentrations, including:
Chemical residues in food
Environmental toxins
Contaminants in medical products
Residual solvents and other unwanted substances
Supporting Product Quality and Safety
Businesses that manufacture products requiring high safety standards—such as food, cosmetics, pharmaceuticals, and medical devices—must ensure that their products are free from hazardous substances and contamination.
Accurate GC-MS testing provides confidence that products meet the required standards and are safe for consumers.
Supporting Compliance with Legal and International Standards
Many countries and industries require testing for chemical residues and contaminants in accordance with strict standards.
GC-MS is a key analytical tool that helps businesses meet these requirements, reducing the risk of regulatory penalties, product rejection, or product recalls.
Strengthening Competitive Advantage
Accurate and clear analytical data enables businesses to communicate the safety and quality of their products to customers and business partners with confidence.
This helps build trust, strengthen business relationships, and support sustainable market expansion.
Key Features of ALS Testing’s GC-MS Services
High Accuracy Through Advanced Equipment and International Standards
ALS Testing uses advanced and high-performance GC-MS technology, together with strict quality-control systems that comply with ISO/IEC 17025, the international standard for testing and calibration laboratories.
This ensures that test results are accurate, reliable, traceable, and internationally recognised.
Comprehensive Services from Sample Receipt to Final Report
We provide an end-to-end service covering every stage of the testing process, including:
Professional sample receipt and preparation
Analysis using advanced instrumentation
Preparation of detailed, clear, and easy-to-understand reports
This enables customers to apply the results immediately to their quality-control and production-improvement processes.
Supports a Wide Range of Sample Types
Our GC-MS services support the analysis of a wide variety of samples, including:
Food
Water
Soil
Air
Cosmetics
Industrial products
Other materials from a wide range of business sectors
This allows us to meet the testing requirements of customers across diverse industries.
In-Depth Technical Consultation
The ALS Testing expert team provides consultation and detailed explanations of analytical results. This helps customers understand the data and apply the findings to improve manufacturing processes and quality-control systems.
As a result, businesses can raise product standards and strengthen their competitiveness in the market.
Test Your Products with Internationally Standardised GC-MS Services from ALS Testing
GC-MS is an important and highly accurate chemical analysis technique that enables businesses to effectively verify product quality and safety.
Prioritising this type of testing helps reduce production risks and increase confidence in the marketplace.
With extensive experience and advanced technology, ALS Testing Services (Thailand) is a trusted partner for comprehensive GC-MS testing services that comply with international standards.
Work with ALS Testing to advance your business towards excellence in product quality and safety—and establish a new standard of confidence for your organisation.
Read moreOctober 8, 2026
Salt Spray Testing, also known as Salt Fog Testing, is one of the most widely used methods for evaluating the surface quality and corrosion resistance of products in the manufacturing industry. It is particularly suitable for metals, steel products, automotive components, electronic equipment, and medical devices. The test helps determine whether these products meet the required quality standards.
Salt Spray Testing is designed to simulate a harsh, corrosive environment inside a controlled test chamber. During the test, a sodium chloride (NaCl) solution is continuously sprayed onto test specimens as a fine mist.
Which Industries Is Salt Spray Testing Suitable For?
Most industrial manufacturers produce products for specific applications. Maintaining production standards and consistent product quality requires careful control of materials and manufacturing processes. As a comprehensive corrosion-testing method, Salt Spray Testing is suitable for the following industries:
1. Automotive Industry
Vehicle frames, bumpers, nuts, screws, and other automotive components should undergo testing to evaluate their expected service life in highly polluted or corrosive environments, such as areas where the atmosphere contains high concentrations of salt.
2. Construction Industry
Salt Spray Testing is also suitable for evaluating metal materials and components used in buildings, bridges, and other structures. It supports effective construction and helps ensure the safety, strength, and durability of materials used in the industry.
3. Electrical and Electronics Industry
Electrical and electronic components installed outdoors or in locations exposed to changing weather conditions may face an increased risk of corrosion. Salt Spray Testing can help assess whether these components offer adequate corrosion resistance.
4. Marine Industry
Components and engines used in shipbuilding and marine operations are well suited to Salt Spray Testing. The test can simulate conditions similar to actual marine environments, helping manufacturers evaluate the quality and suitability of selected materials.
5. Metal Finishing and Coating Industry
Salt Spray Testing can be used to evaluate the quality of protective coatings, including zinc plating, chrome plating, paint coatings, and other surface treatments, and determine how effectively they protect the underlying material against corrosion.
6. Furniture and Outdoor Equipment Industry
Products in this category are commonly installed or used outdoors, where they are exposed to factors that accelerate corrosion. Examples include metal fences, security grilles, front gates, outdoor tables, and outdoor chairs.
Testing helps prevent products from rusting prematurely or experiencing early structural failure caused by corrosion. Such problems may adversely affect product performance and the manufacturer’s brand image.
Benefits of Salt Spray Testing for Product Quality
1. Detect Problems Before Delivery
Salt Spray Testing serves as a final quality-control checkpoint, helping manufacturers identify product defects or weaknesses before delivery.
If the test shows that a product corrodes faster than expected, the engineering team can use the results to improve processes such as surface treatment, material selection, or packaging. This helps prevent products from becoming damaged before reaching customers or developing rust shortly after entering service.
This is particularly important for automotive components, electrical equipment, and industrial products.
2. Improve Product Quality
Salt Spray Testing is an important tool that provides valuable insights for continuous product development. Manufacturers can use the results to modify coating formulations, select more durable materials, or improve manufacturing processes.
These improvements can extend product service life and enhance its resistance to actual operating conditions in the customer’s environment, ensuring that the materials used are more suitable for their intended applications.
3. Strengthen Confidence in the Brand
Conducting Salt Spray Testing through a laboratory accredited to an internationally recognised standard such as ISO/IEC 17025 demonstrates attention to detail and a commitment to producing high-quality products.
In an era when quality and reliability play an increasingly important role in customers’ purchasing decisions, testing by an internationally accredited laboratory can strengthen confidence in the brand among customers and business partners.
Salt Spray Testing Services from ALS Testing
Although some factories may already have basic Salt Spray Testing equipment, businesses requiring reliable results supported by international standards—and results that can be presented to trading partners or used for export purposes—should consider using a professional laboratory such as ALS.
ALS Testing provides the following services and capabilities:
Testing in an ISO/IEC 17025-Accredited Laboratory
Testing conducted in an ISO/IEC 17025-accredited laboratory helps ensure that the laboratory’s activities comply with internationally recognised requirements and that the results are reliable and technically valid.
ISO/IEC 17025 covers two main areas:
1. Technical Competence
Technical competence refers to a laboratory’s ability to conduct testing correctly and reliably. This includes using calibrated equipment, employing knowledgeable and experienced personnel, and following standardised procedures.
These requirements help ensure that every test result is accurate, consistent, traceable, and verifiable.
2. Quality Management System
A quality management system in an ISO/IEC 17025-accredited laboratory establishes the internal structure and procedures required to ensure that every stage of work is systematic, transparent, traceable, and subject to continuous quality control.
ISO/IEC 17025 focuses specifically on testing and calibration activities, unlike ISO 9001, which applies to general quality management systems across a broader range of organisations.
Control of All Parameters Using Calibrated Equipment and an Experienced Team
Every stage of the Salt Spray Testing process is strictly controlled. The laboratory uses calibrated equipment, while testing is performed by knowledgeable and experienced personnel.
This ensures that the results are accurate, reliable, and scientifically explainable.
Clear Reports with Interpretation by Technical Experts
Test reports contain detailed records of the testing process, including data, photographs, and environmental conditions at different stages of the test.
The results are analysed and interpreted by qualified technical experts, enabling customers to compare the findings directly with industry standards or specific customer requirements. This helps determine whether the product passes or fails the specified quality criteria.
Technical Consultation and Corrective Recommendations
If a tested product fails to meet the required standard, our technical experts can conduct a detailed root-cause analysis to identify the actual source of the problem.
Potential causes may include improper surface preparation, inconsistent coating application, or material-related factors affecting corrosion resistance. The findings can then be used to develop appropriate corrective actions and product improvements.
Raise Product Standards with Salt Spray Testing from ALS
In an era of intense competition in industrial product quality, reliable test results supported by internationally recognised standards are essential. They help ensure that your products can fully meet market requirements and customer expectations.
ALS Testing provides comprehensive and highly accurate Salt Spray Testing services to help you identify problems before product delivery and reduce the risk of product failure after entering the market. Test results can also support product development, improve overall quality, and strengthen confidence among customers and business partners.
Choose Salt Spray Testing from ALS’s professional laboratory today to enhance your product quality and standards.
Read moreSeptember 1, 2026
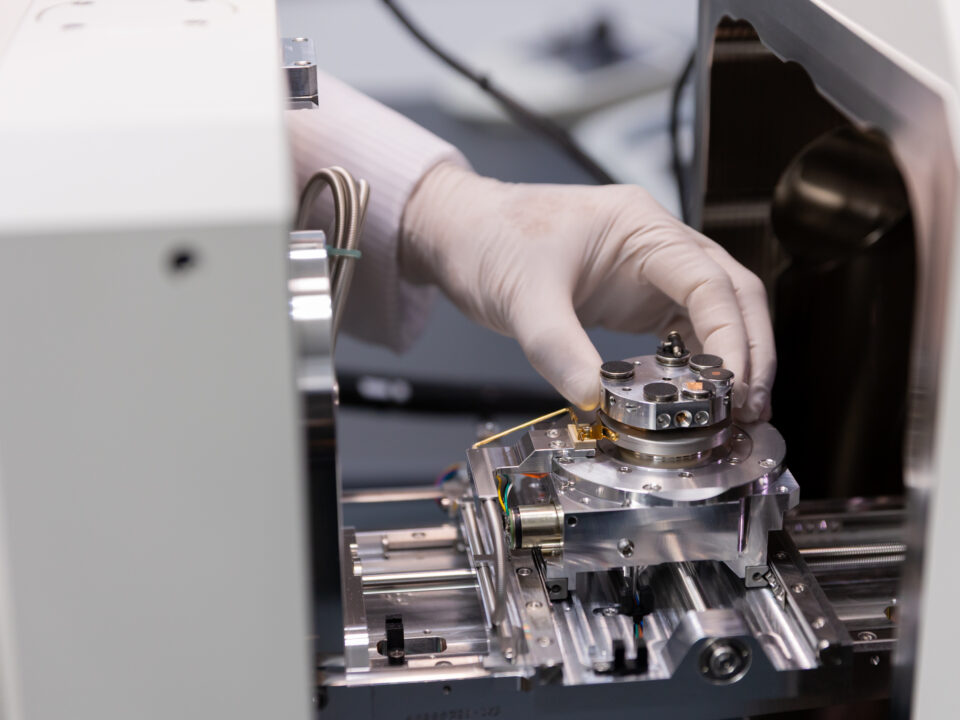
Technical Cleanliness · ISO 16232 · EV Battery Thermal Management · Particle Extraction · Cleanliness Classification
ISO/IEC 17025 Accredited Testing Where Applicable | ISO 16232 and VDA 19 Capability | EV Component Testing Support
Background
[PLACEHOLDER: Insert 2-3 sentences describing the client. Example structure below — to be replaced with real data]
A [Tier-1 supplier / OEM / component manufacturer] producing [component type, e.g. battery cooling manifolds / thermal management plates / coolant distribution components] for [EV platform / programme type] required cleanliness testing of [component description] before delivery to [customer / assembly plant].
The cleanliness requirement was defined by [OEM specification / internal quality requirement / customer purchase specification], specifying [cleanliness class or particle limits] for components destined for [application, e.g. battery thermal management circuits / high-voltage cooling systems].
Why Cleanliness Matters for EV Battery Components
Electric vehicle battery systems introduce cleanliness requirements that go beyond those applied to conventional powertrain components. The reasons are specific to the thermal management architecture of lithium-ion battery packs.
Battery thermal management systems circulate a cooling fluid through a network of channels machined or formed into battery modules, cell holders, and cooling plates. These channels are often narrow, the fluid flow rates are precisely controlled, and the thermal performance of the system depends on consistent, unrestricted flow. A particle that would cause no functional problem in a large-bore hydraulic circuit can restrict flow, create a hotspot, or damage a pump seal in a battery cooling circuit.
Beyond thermal management, cleanliness is increasingly relevant to high-voltage battery assemblies where conductive particles, particularly metallic particles, can bridge insulation gaps and create safety-critical short circuit risks. This is why some EV OEMs are extending cleanliness requirements from hydraulic and fuel system components to battery assembly components, applying ISO 16232 or VDA 19 particle limits to components that had no cleanliness specification requirement in conventional powertrain programmes.
The Testing Requirement
[PLACEHOLDER: Insert specific requirement details]
The applicable standard was [ISO 16232 / VDA 19 / both].
The specified cleanliness requirement was [insert cleanliness class or particle count limits, e.g. maximum X particles above Y µm per 1,000 cm²].
The components submitted for testing were [insert component description, e.g. aluminium coolant manifolds / extruded cooling plates / injection-moulded coolant distribution components], with a functional surface area of approximately [X cm²] per component.
[Number] components were submitted from [production lot / qualification batch / process validation run].
Approach
Extraction Method Selection
[PLACEHOLDER: Insert actual extraction method used and rationale]
The geometry of the component determined the extraction method. [Insert one of: Pressure rinsing was selected because the component contained internal channels with defined inlet and outlet ports, allowing a controlled solvent flow path. / Ultrasonic extraction was selected because the component had complex surface geometry and recesses that pressure rinsing could not reach effectively. / Agitation was selected based on component size and the accessible nature of the relevant surfaces.]
A blank test was performed before component extraction to confirm that the extraction equipment, solvent, and filtration setup contributed particle counts below the defined blank acceptance level.
Analysis
After extraction, the solvent was filtered through a [5 µm] nylon membrane. The membrane was dried and weighed for gravimetric analysis. The extracted particles were re-suspended and run through the LPC instrument for size distribution counting. The membrane was then examined under the calibrated microscope for particle classification by type: metallic shiny, metallic non-shiny, fibre, and other non-metallic.
[PLACEHOLDER: Add SEM-EDX step if applicable] [SEM-EDX analysis was applied to [X] particles above [Y µm] as required by the specification, to provide elemental identification of the largest metallic shiny particles found.]
Results
[PLACEHOLDER: Insert actual test results — requires real data]
Gravimetric result: [X mg / 1,000 cm²]
LPC size distribution
Size class
Particles per 1,000 cm²
Specification limit
[B: 5–15 µm]
[result]
[limit or N/A]
[C: 15–25 µm]
[result]
[limit or N/A]
[D: 25–50 µm]
[result]
[limit or N/A]
[E: 50–100 µm]
[result]
[limit or N/A]
[F: 100–150 µm]
[result]
[limit or N/A]
[G: 150–200 µm]
[result]
[limit or N/A]
[H: 200–400 µm]
[result]
[limit or N/A]
Largest metallic shiny particle: [X µm] Largest non-metallic particle: [X µm] Longest fibre: [X µm]
Component Cleanliness Code: [CCC result]
Overall result: [Pass / Fail / Conditional pass with comment]
[PLACEHOLDER: Add 2-3 sentences on what the results showed, e.g. whether the components passed, whether any size class was close to the limit, and any notable finding from particle classification]
What the Results Showed
[PLACEHOLDER: Insert 2-3 sentences summarising findings and outcome]
[Example structure: The results confirmed that all [X] components met the specified cleanliness class in all size ranges above [Y µm]. The largest metallic shiny particle measured [X µm], below the [Y µm] critical particle threshold defined in the specification. The components were released for [delivery / assembly / customer submission].]
[OR if there was a finding: The initial results identified [describe finding]. This was traced to [source — e.g. a specific machining step / packaging material / handling practice], and the supplier implemented [corrective action]. Retesting after corrective action confirmed that the component met the specified cleanliness class.]
Relevance to EV Cleanliness Testing
This type of investigation reflects a broader trend in EV component qualification. As battery thermal management system designs become more complex and cleanliness requirements extend from conventional powertrain components to EV-specific parts, the analytical workflow developed for ISO 16232 and VDA 19 testing is being applied to component geometries and material types that were not part of traditional cleanliness testing programmes.
ALS has been providing technical cleanliness testing to ISO 16232 and VDA 19 since 2014, with ISO/IEC 17025 accreditation since 2019. As EV production scales across Malaysia and Southeast Asia, the cleanliness testing capability developed for conventional automotive components is directly applicable to EV battery system components, providing Tier-1 suppliers and OEM assembly programmes with the accredited cleanliness data they need for qualification and process validation.
Frequently Asked Questions
Does ISO 16232 apply to EV battery components or only to conventional powertrain parts?
ISO 16232 is applicable to any automotive component where particulate contamination poses a functional risk. The standard does not restrict application to conventional powertrain components. As EV OEMs define cleanliness specifications for battery thermal management and high-voltage assembly components, ISO 16232 provides the established test framework for demonstrating compliance. In practice, the specific cleanliness limits for EV components are defined by the OEM or customer specification, not by ISO 16232 itself.
What extraction method is typically used for EV battery cooling components?
The extraction method depends on the geometry of the specific component. Cooling manifolds and plates with internal channels and defined flow paths are typically tested by pressure rinsing, which forces solvent through the internal channels under controlled pressure. Components with more complex external geometry or recessed features may be tested by ultrasonic extraction. The extraction method is validated for each component type before production testing begins.
Can ALS test EV battery components for cleanliness under ISO/IEC 17025 accreditation?
Yes. ALS Testing provides technical cleanliness testing to ISO 16232 and VDA 19 under ISO/IEC 17025 accreditation. For testing where accredited results are specifically required, confirm the exact method and scope with the laboratory at the enquiry stage.
Next Steps
See our full Automotive Testing services including EV component testing
See our Technical Cleanliness Testing services for ISO 16232 and VDA 19
Contact our team to discuss EV component cleanliness testing requirements
ISO/IEC 17025 Accredited Testing Where Applicable | ISO 16232 and VDA 19 Capability | EV Component Cleanliness Testing Support
Read moreSeptember 1, 2026
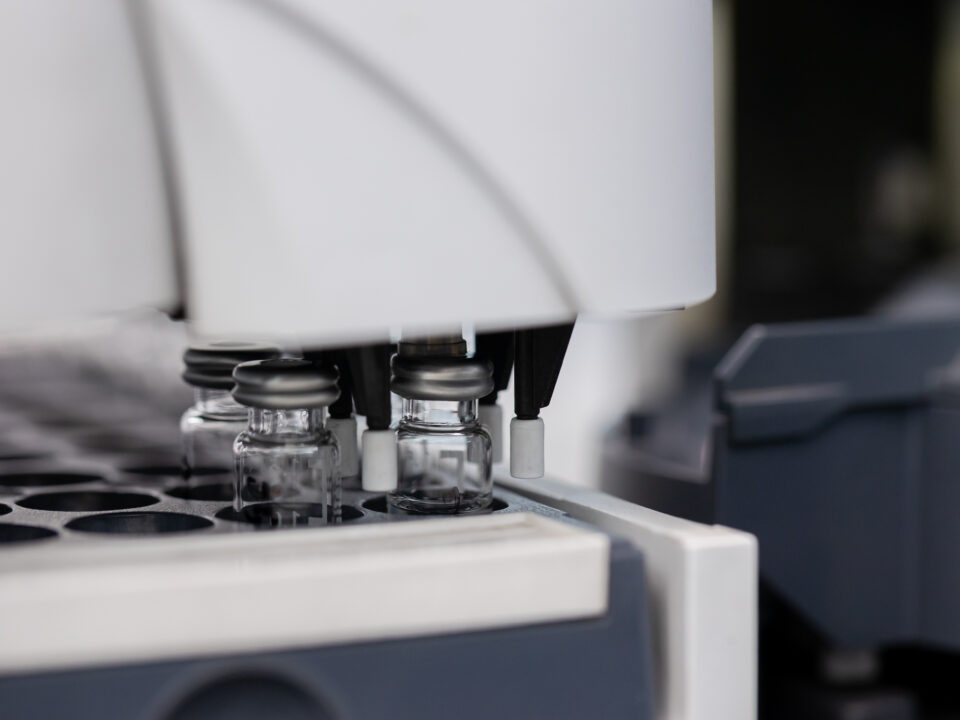
Interior Air Quality · Health and Regulatory Context · OEM Qualification · VDA 278 · ISO 12219
ISO/IEC 17025 Accredited Testing Where Applicable | VDA 278 and ISO 12219 Capability | Automotive Materials Specialist
The smell of a new vehicle is one of the most recognisable sensory experiences in the automotive market. What produces that smell is less well understood. It is the combined off-gassing of dozens of organic compounds released by interior materials: adhesives, foam components, trim polymers, coatings, and carpet binders, all emitting volatile compounds into the confined air space of the cabin.
Most of these compounds dissipate quickly and are present at concentrations that raise no immediate health concern. A smaller number, including formaldehyde, benzene, toluene, and certain carbonyl compounds, are associated with health effects at elevated concentrations, and it is these compounds that have driven the development of automotive VOC emission standards and the testing requirements that OEMs impose on their material suppliers.
This guide explains what VOCs are, which compounds matter most from a health perspective, and how automotive testing standards address them.
What Are VOCs and Where Do They Come From in Automotive Interiors
VOC stands for volatile organic compound. The term describes carbon-based chemicals that evaporate readily at room or slightly elevated temperatures, releasing into the surrounding air. In a vehicle cabin, the materials that contribute most significantly to VOC concentrations include the following.
Material
Primary VOC contributors
Instrument panels and dashboard covers
Aromatic hydrocarbons, plasticisers
Seat foam (polyurethane)
Amine compounds, aldehydes, TDI residues
Headliners and roof lining
Formaldehyde from binder resins, aldehyde compounds
Floor carpets and underfelt
Formaldehyde from latex binders, styrene
Adhesives and sealants
Residual solvents, monomers
Door trim panels
Aromatic hydrocarbons, plasticisers
Wire insulation
Plasticisers, flame retardant emissions
VOC emissions are highest immediately after manufacture, when residual processing chemicals and unreacted monomers are still volatilising. Concentrations decrease significantly over the first weeks and months of vehicle use as the materials off-gas and the residual compounds are depleted. This pattern, sometimes described as the new car smell diminishing with time, reflects the natural decline in VOC emission rates as materials approach equilibrium.
Health Context, Which Compounds Are of Concern
Not all VOCs carry the same health significance. At the concentrations typically found in vehicle cabins, most compounds are not associated with acute health effects. A smaller number are subject to regulatory limits or OEM-specified thresholds because of their established health associations.
Compound
Health association
Why it matters in automotive
Formaldehyde
Known human carcinogen at high concentrations, irritation at lower levels
Emitted by adhesive resins, textile binders, and foam systems. Subject to dedicated test method VDA 275 alongside VDA 278
Benzene
Known human carcinogen
Present as residual impurity in aromatic solvents and some polymer processing materials
Toluene and xylene
Neurological effects at high occupational concentrations
Tracked as part of total aromatic hydrocarbon group limits in OEM specifications
Acetaldehyde
Irritation effects, possible human carcinogen
Emitted by some adhesive systems and polyurethane foam formulations
Amine compounds
Hygroscopic and irritation-promoting properties
Indicate insufficiently deactivated catalyst residues in polyurethane foam
OEM limits applied in automotive material testing are precautionary thresholds set to ensure that even sensitive individuals, including children and those who spend significant time in vehicles, are not exposed to compounds of concern at levels that could cause harm over a vehicle service life of ten years or more.
Regulatory Context in Key Markets
Market
Regulatory status
Key standard or framework
China
Legally binding
GB/T 27630, limits benzene, toluene, xylene, ethylbenzene, styrene, formaldehyde, acetaldehyde, and acrolein
European Union
No single binding regulation
German OEMs impose limits through material specifications referencing VDA 278
Malaysia and Southeast Asia
No direct regulatory requirement
Suppliers serving global OEM supply chains face OEM-imposed specifications regardless of manufacturing location
How VOC Testing Standards Address These Concerns
OEMs define maximum permissible emission limits for specific compounds and compound groups, requiring material suppliers to test against these limits before production approval. The primary standards used for material qualification are:
VDA 278 uses thermal desorption GC-MS to measure VOC and FOG emissions from a material sample, producing a compound-by-compound profile for pass or fail assessment against OEM-specified limits
VDA 275 addresses formaldehyde specifically using a bottle method that provides better sensitivity and specificity than the general thermal desorption approach
ISO 12219-1 covers vehicle-level cabin air testing using the bag method, conducted by the OEM rather than the material supplier
ISO 12219-2 to 12219-7 cover component-level chamber methods used for material qualification at the supplier stage
For aldehyde-specific determination at higher sensitivity, DNPH-HPLC is applied where the specification requires it, providing individual aldehyde quantification beyond the practical range of thermal desorption GC-MS. For a detailed guide to VDA 278 and related standards, see our VOC testing guide.
Common Failure Causes and How to Address Them
Understanding why materials fail VOC tests is as useful as understanding what the tests measure.
Residual processing solvents from adhesives, coatings, and laminates that have not been fully cured or dried before testing are among the most common causes. The corrective action is process optimisation to ensure adequate drying or curing conditions before material dispatch.
Plasticiser migration contributes to the FOG fraction at the 120°C stage in VDA 278. PVC-based and plasticised polymer materials release high-boiling compounds during this stage. Reformulation with lower-emission plasticisers or reduction of plasticiser loading is the typical response.
Formaldehyde from binder resins is a recurring issue in headliners, floor carpets, and foam materials using formaldehyde-based chemistry. Low-emission or formaldehyde-free binder alternatives are available for most applications.
Amine compounds from polyurethane foam indicate incomplete urethane reaction chemistry. Catalyst selection and foam curing conditions affect amine emission levels significantly.
Background contamination from conditioning environments or packaging can elevate results independently of the material itself. Clean conditioning in VOC-free environments using clean packaging materials is essential preparation.
Frequently Asked Questions
Why do OEMs impose VOC limits on materials rather than testing the complete vehicle?
Testing at the material level allows problems to be identified and corrected early in the supply chain, before materials are incorporated into a vehicle. If a trim material fails its VOC qualification, the supplier can reformulate and retest before the material reaches the assembly plant. Vehicle-level testing, such as the GB/T 27630 method in China, occurs at a much later stage and is not a substitute for material-level qualification in OEM supply chains.
Does VOC testing apply to all materials in the vehicle cabin?
In principle, any non-metallic material in the cabin is a candidate. In practice, the materials subject to mandatory VOC testing are defined by the OEM material specification or supplier quality manual for each programme. Materials with high emission potential or large surface area in the cabin, such as instrument panels, seat foams, headliners, and floor carpets, are typically subject to the most stringent requirements.
Is the new car smell itself harmful?
At the concentrations normally found in new vehicles from manufacturers who apply OEM VOC specifications, the compounds responsible for the new car smell are present at levels that are not considered acutely harmful. The health concern relates to prolonged exposure to elevated concentrations of specific compounds, which is why OEM material limits are set conservatively with a long service life in mind. The decline in the smell over time reflects the natural reduction in VOC emission rates as residual compounds are depleted.
What is the difference between VOC testing and fogging testing?
VOC testing measures the volatile organic compounds that evaporate into cabin air and affect air quality. Fogging testing measures the condensable semi-volatile compounds that deposit as a visible film on the windscreen. Both are emission tests on interior materials, but they address different fractions of the emission profile, different health and safety concerns, and use different test methods. Most German OEM specifications require both.
Next Steps
See our full Materials and Environmental Testing services for automotive interior materials
Read our detailed guide on VOC testing for automotive interiors including VDA 278, ISO 12219, and fogging
Read our detailed VDA 278 testing guide: /blog/vda-278-thermal-desorption-testing/
Contact our team for a VOC testing quotation or technical discussion
ISO/IEC 17025 Accredited Testing Where Applicable | VDA 278 and ISO 12219 Capability | Automotive Interior Materials Specialist
Read moreSeptember 1, 2026
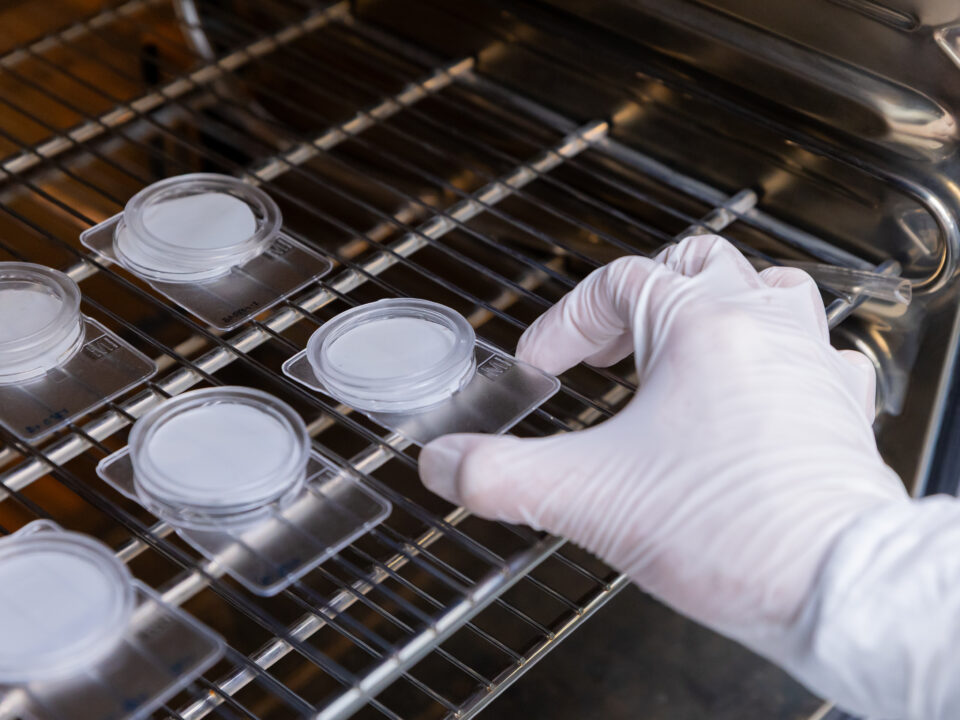
Particle Size Distribution · Cleanliness Classification · ISO 16232 · VDA 19 · Light Obscuration Counting
ISO/IEC 17025 Accredited Testing Where Applicable | LPC and Full Particle Analysis Capability | Automotive Cleanliness Specialist
Gravimetric analysis tells you how much particle contamination is present by total mass. Liquid-borne particle counting tells you how that contamination is distributed across size ranges. In most automotive cleanliness specifications, it is the size distribution data, not the total mass, that determines whether a component passes or fails.
Liquid-borne particle count (LPC) is the analytical step that generates this size distribution. It is a required element of technical cleanliness testing under ISO 16232 and VDA 19, and it is the method that translates extracted particle contamination into the cleanliness classification your OEM specification requires.
What Liquid-Borne Particle Counting Measures
LPC measures the number of particles present in a liquid suspension within defined size ranges. In automotive cleanliness testing, the liquid is the extraction solvent that has been used to remove particles from a component, filtered onto a membrane to collect the particles, and then re-suspended in clean solvent for analysis.
The instrument passes this particle suspension through a measurement cell where a laser beam intersects the flow path. As each particle passes through the beam, it obstructs a portion of the light, causing a brief reduction in the light signal detected on the far side. The instrument measures the magnitude of this light reduction, which correlates with particle size, and records the event as a count in the appropriate size class.
The result is a particle size distribution: the number of particles counted in each defined size range, expressed as particles per unit surface area of the component tested. This distribution is the core data used to assign the cleanliness classification under ISO 16232 or VDA 19.
Why LPC and Gravimetric Analysis Are Used Together
Gravimetric analysis and LPC are complementary measurements that answer different questions about the same particle contamination.
Measurement
What it shows
Limitation
Gravimetric analysis
Total mass of all extracted particles
Cannot distinguish size distribution or individual large particles
Liquid-borne particle count (LPC)
Number of particles in each size class
Does not show total mass or particle material
A component may pass the gravimetric mass limit while still containing one or two oversized particles that exceed the size class limit and trigger a cleanliness failure. A component may show a high total particle count in the smallest size class while all larger size classes are within specification, which may be entirely acceptable depending on the OEM requirement.
Neither measurement alone gives the complete picture that a cleanliness specification requires. ISO 16232 and VDA 19 require both, and the LPC size distribution data is what generates the cleanliness class that appears on the test report.
How LPC Fits into the ISO 16232 and VDA 19 Workflow
LPC is performed after particle extraction and filtration, and before or alongside microscopic particle classification.
The sequence is as follows. Particles are extracted from the component using the validated extraction method for that component type. The extraction solvent is filtered through a membrane with a defined pore size, collecting the particles. The membrane is dried and weighed for gravimetric analysis. The particles on the membrane are then re-suspended in a defined volume of clean solvent and the resulting suspension is run through the LPC instrument.
The LPC result, combined with the gravimetric mass and the microscopic classification data, forms the basis of the Component Cleanliness Code (CCC) that is reported to the OEM or customer. The size classes defined in ISO 16232 and VDA 19 cover a range from particles above 5 or 50 micrometres at the lower end, depending on the analysis type specified, up through multiple ranges to particles above 1,000 micrometres.
For a detailed explanation of the full cleanliness testing workflow, see our guide on particle analysis in automotive manufacturing.
LPC in Fluid Cleanliness Testing
LPC is also applied to fluid cleanliness monitoring in hydraulic systems, fuel systems, and cooling circuits, where the liquid tested is the operating fluid itself rather than an extraction solvent.
Category
Component Cleanliness Testing
Fluid Cleanliness Monitoring
Standard
ISO 16232, VDA 19
ISO 4406 and equivalent
Sample
Extraction solvent from component
Operating fluid drawn from system
Purpose
Characterises particles a component releases into a system on first assembly
Characterises ongoing contamination level during service
When applied
Qualification and production testing
Commissioning, service monitoring
Result format
Cleanliness classification (CCC)
Three-number code per ISO 4406
Both use LPC as the core measurement, but the sample preparation, reference standards, and acceptance criteria are different.
What Affects LPC Result Accuracy
LPC results are sensitive to several factors that must be controlled during sample preparation and analysis.
Re-suspension quality. Particles on the membrane must be fully and uniformly re-suspended. If re-suspension is incomplete, the count will be lower than the actual contamination level.
Background particle counts. Solvent, glassware, and instrument must be verified clean. A blank count is performed before or alongside the sample to confirm the analysis environment is not contributing particles that would distort the result.
Analysis volume accuracy. The volume of suspension analysed must be recorded and used correctly in calculating the final result per unit surface area. Errors in volume translate directly into errors in the reported count.
Sample stability. Agglomeration of particles during any delay between extraction and analysis can shift the apparent size distribution toward larger sizes, reducing the count in smaller size classes.
Frequently Asked Questions
What is the difference between LPC and optical microscopy for particle counting?
LPC counts particles automatically using light obscuration as they pass through the measurement cell in liquid suspension, providing fast, statistically representative counts across the full size distribution. Optical microscopy examines particles on the filter membrane directly, allowing visual classification by type (metallic shiny, non-metallic, fibre) and morphology, but typically covers a smaller sample area. Both methods are required under ISO 16232 and VDA 19: LPC for the size distribution count and microscopic analysis for particle type classification.
Can LPC identify the type of particles counted?
No. LPC counts and sizes particles based on light obscuration but cannot identify whether a particle is metallic, non-metallic, a fibre, or any specific material type. Particle type classification requires microscopic examination of the filter membrane. Material identification of specific particles requires SEM-EDX or FTIR analysis.
What size particles does LPC detect in cleanliness testing?
The lower detection threshold in standard automotive cleanliness testing is typically 5 or 50 micrometres, depending on the analysis type specified by the applicable standard edition or OEM requirement. Particles smaller than the lower threshold are not individually counted and do not contribute to the cleanliness classification. The upper size limit is set by the largest size class defined in the specification, typically particles above 1,000 micrometres.
Does LPC replace gravimetric analysis in cleanliness testing?
No. Both are required under ISO 16232 and VDA 19 for a complete cleanliness test. Gravimetric analysis provides the total contamination mass, and LPC provides the size distribution. They answer different questions and neither substitutes for the other.
Next Steps
See our full Technical Cleanliness Testing services including LPC and particle analysis
Read our guide on particle analysis methods, standards and applications
Read our guide comparing ISO 16232 and VDA 19
Contact our team for a particle analysis or cleanliness testing quotation
ISO/IEC 17025 Accredited Testing Where Applicable | LPC and Particle Analysis Capability | Automotive Cleanliness Specialist
Read moreSeptember 1, 2026
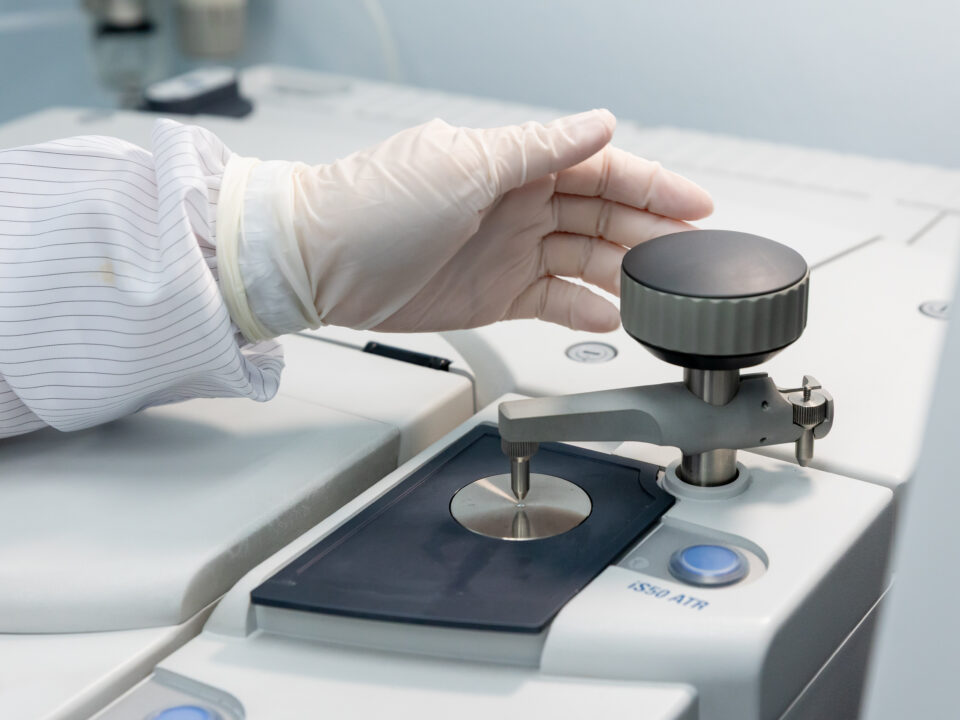
Fourier Transform Infrared Spectroscopy · Microscope FTIR · Organic Contamination · Polymer Identification · Residue Analysis
ISO/IEC 17025 Accredited Testing Where Applicable | FTIR and Microscope FTIR Capability | Automotive Failure Analysis
A fracture surface has been imaged by SEM. EDX has identified the elements present. But the contaminating film on the contact surface, the residue beneath a delaminating coating, or the foreign particle on the filter membrane still cannot be identified by imaging or elemental analysis alone. The material is organic, and organic materials require a different analytical technique.
FTIR spectroscopy is that technique. It identifies organic materials by measuring how they absorb infrared light and comparing the resulting spectrum against reference data, producing a material identification that SEM and EDX cannot provide. In automotive failure analysis and contamination investigation, FTIR is not a replacement for SEM. It is the complementary technique that closes the gap SEM leaves open.
How FTIR Works
Fourier transform infrared spectroscopy exposes a sample to infrared radiation across a defined wavelength range. Different chemical bonds within the sample absorb infrared energy at characteristic wavelengths. The instrument measures which wavelengths are absorbed and which pass through, producing a spectrum that represents the molecular fingerprint of the material.
This fingerprint is compared against a reference library of known spectra. When a match is found, the material is identified. When an exact match is not found, the spectrum can still characterise the chemical class of the material, distinguishing, for example, a polyamide from a polyester, or an epoxy from a silicone.
FTIR is a non-destructive technique for most sample types. The measurement does not consume or alter the sample, which means other analytical techniques can be applied to the same sample after FTIR analysis. This is particularly important in failure analysis, where the available sample may be small and every analysis step needs to be planned in sequence.
Bulk FTIR and Microscope FTIR, Two Distinct Capabilities
Bulk FTIR and Microscope FTIR, Two Distinct Capabilities. FTIR is available in two configurations, each suited to different sample types and analytical objectives.
Bulk FTIR analyses a macroscopic sample across the entire exposed surface or a defined area. It suits material characterisation of solid samples, films, coatings, and extracted residues where the material is relatively homogeneous. Common applications include:
Identifying the polymer type of a seal, gasket, or housing material
Characterising an adhesive or sealant
Identifying a contaminating film extracted from a component surface
Microscope FTIR focuses the infrared beam onto a specific, localised area using a coupled microscope, allowing identification of organic contaminants as small as 20 micrometres. It is used when:
Contamination is spatially localised
A single particle or small residue area needs to be identified without contribution from surrounding material
Contamination is embedded within a larger sample and must be characterised in place
What FTIR Can Identify in Automotive Applications
FTIR is applicable across a wide range of organic material types encountered in automotive components and failure investigations.
Material category
Typical FTIR application
Polymers and plastics
Identifying seal materials, housing resins, trim polymers, and polymer contaminants
Elastomers and rubber
Characterising gaskets, O-rings, and sealing elements by polymer type
Adhesives and sealants
Identifying adhesive type and cure state in bonded assemblies
Coatings and paint
Characterising coating chemistry and identifying delamination-related residues
Oils and lubricants
Identifying lubricant type, degradation products, and oil contamination
Organic residues and films
Identifying flux residues, processing chemical residues, and organic contamination films
Fibres
Identifying synthetic and natural fibre types in contamination investigations
Particles on filter membranes
Identifying organic particles extracted during cleanliness testing
FTIR is not suitable for elemental or inorganic material identification. It does not identify metals, metal oxides, or inorganic minerals with the same specificity as EDX. Where a sample contains both organic and inorganic components, FTIR and SEM-EDX are applied together, each contributing the information the other cannot provide.
FTIR in Automotive Failure Analysis
In a structured failure analysis investigation, FTIR typically follows visual and optical examination and SEM-EDX analysis. By the time FTIR is applied, the analyst usually has a clear hypothesis about what the organic material might be, and FTIR provides the confirmation or identifies an unexpected material that changes the direction of the investigation.
FTIR in Automotive Failure Analysis, Common Scenarios
Coating delamination and adhesion failures. When a coating or bonded layer separates from its substrate, the locus of failure often involves an organic residue or film at the interface. FTIR can identify whether this film is a processing chemical, a lubricant, a mould release agent, or an incompatible primer that prevented adhesion.
Seal and gasket failures. When a seal fails to contain fluid pressure, the seal material may have degraded, swollen, or hardened due to chemical incompatibility with the fluid it is sealing. FTIR identifies the seal polymer type and, in conjunction with comparison samples, can detect chemical degradation through changes in the infrared spectrum.
Contamination source investigation. When organic particles are found on precision component surfaces, on filter membranes from cleanliness testing, or on electrical contact surfaces, FTIR identifies the material. A fibre identified as a specific synthetic polymer type can be traced to a known packaging or cleaning material. A particle identified as an epoxy resin can be traced to an assembly process. This material identification guides corrective action by pointing toward a specific source rather than leaving the contamination origin unresolved.
PCB and electronics failure analysis. Organic residues and films on PCB assemblies, connector contacts, or electronic component surfaces are a common cause of reliability problems. FTIR identifies whether the residue is flux-related, lubricant contamination, or an organic film from handling or packaging, complementing IC analysis of ionic species and SEM-EDX elemental data.
FTIR and SEM, Using Both Techniques Together
FTIR and SEM are complementary techniques that address different questions about the same sample.
Technique
What it provides
SEM
High-magnification surface imaging and morphology
EDX
Elemental composition at specific points, lines, or areas
FTIR
Molecular identity of organic materials
Microscope FTIR
Molecular identity of localised organic contaminants down to 20 µm
Together, they cover both the inorganic and organic dimensions of a contamination or failure problem. A typical combined workflow proceeds as follows: SEM imaging locates a residue or particle at the failure site. EDX confirms the particle is carbon-rich, consistent with an organic material, but cannot identify what type. Microscope FTIR is then applied to the same particle, identifying it as, for example, a polyurethane foam fragment consistent with packaging contamination.
This combination is particularly valuable in cleanliness testing follow-up investigations, where organic particles identified on filter membranes by microscopic classification require material identification to support contamination source tracing. For a detailed explanation of SEM and EDX analysis, see our guide on scanning electron microscopy analysis for failure analysis.
Frequently Asked Questions
What is the smallest particle or feature that Microscope FTIR can identify?
Microscope FTIR at ALS can identify organic contaminants down to approximately 20 micrometres in size. Below this size, the infrared signal from the feature of interest may be insufficient for reliable library matching. For particles smaller than this threshold, alternative techniques such as SEM-EDX for elemental analysis or Raman spectroscopy at specialist facilities may be more appropriate.
Can FTIR identify inorganic contamination?
FTIR is primarily a technique for organic material identification. It can detect some inorganic compounds, particularly those with strong infrared absorption bands such as carbonates, sulfates, and silicates, but it is not the primary technique for inorganic identification. SEM-EDX is the appropriate method for elemental and inorganic material characterisation.
Do I need to send a separate sample for FTIR analysis, or can it be performed on the same sample used for SEM?
In most cases, FTIR can be performed on the same sample used for SEM analysis, provided the sample has not been coated with a conductive layer for SEM. Where a conductive coating has been applied, it may interfere with FTIR analysis depending on coating thickness and material. Discuss the planned analytical sequence with the laboratory before any sample preparation begins.
How long does FTIR analysis take? Bulk FTIR analysis of a prepared sample typically takes less than a day. Microscope FTIR analysis of localised contaminants or particles takes longer, depending on the number of features to be analysed and the complexity of the spectral interpretation. For investigations combining FTIR with SEM and other techniques, turnaround depends on the full analytical programme. Discuss timing requirements at the enquiry stage.
Next Steps
See our full Failure Analysis services including FTIR and Microscope FTIR capability
Read our guide on scanning electron microscopy analysis for failure investigation
See our Chemical and Electronics Testing services for organic residue analysis on PCBs
Contact our team to discuss a failure analysis investigation
ISO/IEC 17025 Accredited Testing Where Applicable | FTIR and Microscope FTIR Analysis | Automotive Failure Analysis Support
Read moreSeptember 1, 2026
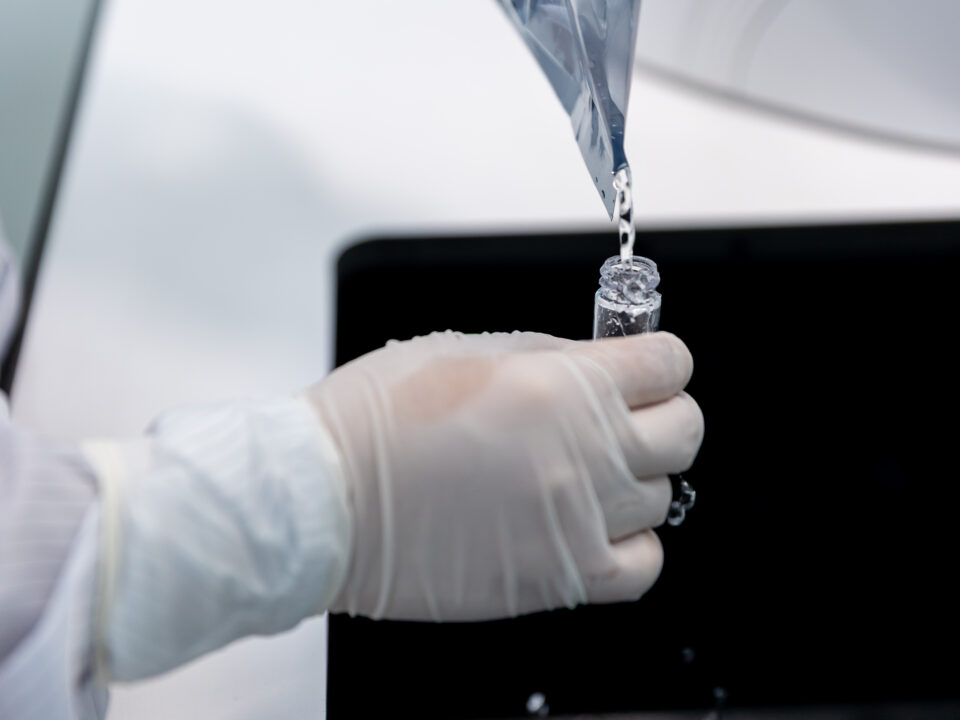
Anion and Cation Analysis · Anion Test · IPC-TM-650 2.3.28 · Root Cause Investigation · Chloride and Ammonium Identification · Failure Evidence
ISO/IEC 17025 Accredited Testing Where Applicable | Anion and Cation Analysis | Chemical and Electronics Testing
A PCB assembly has been returned from the field with intermittent electrical failure. SEM examination shows corrosion on conductor surfaces. The failure mode suggests ionic contamination-driven electrochemical attack. The question that determines corrective action is not whether ionic contamination is present but which ionic species are responsible and where they came from.
Ion chromatography, commonly referred to as the anion test in electronics manufacturing, answers that question. It separates and quantifies individual ionic species in the extract from a PCB surface, providing species-level identification that points directly toward the contamination source and the process step that should be investigated. In PCB failure analysis, IC is not a routine quality check. It is a diagnostic tool.
The Role of IC in PCB Failure Investigation
Ion chromatography for PCB failure analysis differs from IC used in production quality monitoring in one important respect: the objective. In production monitoring, IC confirms that ionic contamination levels are within the specified cleanliness limit. In failure analysis, IC is used to understand what happened after a failure has already occurred.
When a PCB assembly fails in service and ionic contamination is suspected as a contributing factor, IC provides three things that other analytical techniques cannot.
Species identification. IC identifies which ionic species are present and in what quantities across three categories: anions including chloride, fluoride, bromide, sulfate, and phosphate; cations including ammonium, sodium, and potassium; and weak organic acids (WOA) including acetate, formate, and citrate, which are characteristic markers of no-clean flux residue activity. Without species identification, corrective action is guesswork.
Quantification at failure-relevant levels. Modern IC systems detect ionic species at concentrations of parts per billion in the extract solution, translating to nanograms per square centimetre on the board surface. These detection limits allow meaningful measurement even when contamination levels are low, as is often the case with field failures where the original contamination may have been borderline or where the board has experienced some self-remediation during service.
Evidence for the investigation record. A failure analysis report supported by IC data includes objective, quantitative evidence of contamination levels and species distribution. This supports decisions about corrective action, supplier responsibility, and process qualification in a way that qualitative observations cannot.
What the Key Ionic Species Indicate
The diagnostic value of IC in failure analysis comes from understanding what each ionic species indicates about its origin.
Ionic species Type Primary implication in PCB failure analysis Chloride Anion Flux activator residue, environmental chloride exposure, halogenated material contamination Fluoride Anion Specific flux formulations, etching process residues Bromide Anion Halogenated flux systems, flame retardant materials Nitrate Anion Environmental sources, cleaning chemistry Nitrite Anion Environmental sources, some process chemistry Phosphate Anion Some flux formulations, process chemical residues Sulfate Anion Environmental deposition, some flux chemistry, atmospheric contamination during storage Sodium, potassium Cation Handling contamination, process water, environmental sources Ammonium Cation No-clean flux amine activators, incompletely deactivated flux residue Calcium, magnesium Cation Process water, environmental contamination Lithium Cation Specific process chemistry, battery-related contamination Acetate, formate WOA No-clean flux activator decomposition products Citrate, malate, succinate WOA Flux chemistry residues, organic acid activators Methanesulfonate WOA Specific flux formulations Phthalate WOA Plasticiser migration, packaging contamination
Chloride is the most significant anion in PCB failure analysis. Even at low concentrations, it initiates pitting corrosion and supports dendritic growth between conductors under voltage bias. Elevated ammonium, organic amines, or WOA species such as acetate and formate indicate no-clean flux residue that has not been fully deactivated and retains corrosion-promoting properties despite a nominally clean process.
ALS Testing analyses all three ionic categories under IPC-TM-650 2.3.28: anions (chloride, fluoride, bromide, nitrate, nitrite, phosphate, sulfate), cations (ammonium, sodium, potassium, calcium, magnesium, lithium), and weak organic acids or WOA (acetate, formate, citrate, malate, succinate, methanesulfonate, phthalate). A full species profile across all three categories provides the most complete picture of contamination source and corrosion risk. IC and SEM-EDX Together in Failure Investigation Ion chromatography and SEM-EDX analysis are complementary in PCB failure investigation. Each provides information the other cannot. SEM imaging characterises the morphology of corrosion damage at the failure site: the distribution of corrosion products, the pattern of dendritic growth, the condition of solder joint surfaces, and any visible residues or contamination. EDX analysis at specific points within the corrosion zone identifies the elemental composition, which can support or question the hypothesis generated by IC results. Detecting chlorine by EDX at a corrosion site is consistent with chloride-driven corrosion. Detecting sulfur is consistent with sulfate-related attack. What EDX cannot do is quantify the contamination level across the board surface or distinguish between the many possible ionic species that contain chlorine or sulfur. IC provides that quantification and speciation, working across the full board surface rather than at specific isolated points. A complete PCB failure investigation typically uses IC to characterise the overall ionic contamination profile and identify the dominant species, and SEM-EDX to characterise the specific failure site morphology and elemental composition. Together, they provide the evidence base needed for a defensible root cause conclusion. For a broader explanation of how SEM, EDX, and FTIR contribute to failure analysis, see our guide on scanning electron microscopy analysis for failure investigation. The Extraction Method Matters The reliability of IC results in failure analysis depends on how the extraction is performed. The method must be consistent, validated, and appropriate for the investigative objective, since errors or deviations at the extraction stage propagate directly into the analytical results and can obscure or misrepresent the actual contamination state of the board. Standard procedure. IPC-TM-650 2.3.28 defines the extraction method: the board is placed in a clean vessel with 75% isopropyl alcohol and 25% deionised water, extracted at 80°C for one hour under agitation, then filtered and injected into the IC system. This dissolves ionic species from the board surface including flux residues not fully soluble in water alone. Extract as received. For failure analysis, the extraction must be performed on the assembly without prior cleaning or alteration to preserve the contamination evidence in its original state. Area-specific extraction. Where the investigation requires spatial information, a controlled volume of extraction solvent applied to a defined surface area allows IC to map where contamination is most concentrated, which can be decisive in identifying the contamination source. Limitations of IC Results in Failure Investigation IC results are powerful evidence but require careful interpretation. Three limitations apply in most failure analysis contexts. IC does not identify the responsible process step or supplier. Species identification points toward contamination sources, for example chloride toward flux residue or environmental exposure, and ammonium toward no-clean flux deactivation failure. But identifying which specific process step, supplier, or handling event introduced the contamination requires interpreting IC data in the context of the full assembly process history, materials used, handling conditions, and failure pattern. IC reflects contamination at the time of testing, not necessarily at the time of failure. In boards returned from extended service, some ionic species may have been consumed by the corrosion reactions they initiated, reducing the measured concentration below the original level. Others may have been introduced by service environment exposure after the original failure mechanism was already underway. Interpreting IC results from aged field returns requires judgement about what the data represents and what may have changed since manufacture. A single IC result has limited diagnostic power without comparison data. A contamination level that looks elevated in isolation may be normal for the process, or it may indicate a process excursion if compared against qualification data. Results from non-failed assemblies from the same production lot, or from process qualification records, provide the reference point that makes species level differences meaningful and points toward the contamination source. Frequently Asked Questions When should IC be included in a PCB failure analysis investigation? IC should be included when ionic contamination is a plausible contributor to the failure mechanism, covering most cases of corrosion, leakage current, dendritic growth, or intermittent electrical behaviour associated with humidity exposure. It should also be included when the investigation needs to differentiate between flux residue contamination and environmental contamination, since anion test species profiles typically distinguish between these sources. Can IC analysis be performed on a board that has already been through SEM examination? In most cases yes, provided the SEM examination was performed without sputter coating the board surface, and provided the board has not been cleaned or altered during the SEM investigation. Discuss the planned analytical sequence with the laboratory before any step that might affect the surface chemistry of the board. What information should I provide when submitting a failed PCB for IC analysis? The most useful information includes the assembly process description (flux type, cleaning or no-clean process), service history including environment and duration, visual or functional observations from the failure, the OEM cleanliness specification if one applies, and whether comparison samples from the same production lot are available. For no-clean assemblies, note whether WOA analysis is required alongside standard anion and cation testing, as WOA species are particularly relevant to no-clean flux residue characterisation. How does IC for failure analysis differ from routine production anion testing? The analytical method is the same. The difference is in the objective and interpretation. Production anion testing confirms ionic contamination is within the specified limit. Failure analysis IC characterises the contamination profile of a failed assembly and generates hypotheses about the source and mechanism of failure, interpreted against the full failure evidence rather than a pass or fail threshold alone. Next Steps See our full Chemical and Electronics Testing services including IC for PCB failure analysis See our Failure Analysis services including SEM-EDX for corrosion and contamination investigation Read our guide on PCB cleanliness testing and ion chromatography for production quality control context Contact our team to discuss a PCB failure analysis investigation ISO/IEC 17025 Accredited Testing Where Applicable | Anion and Cation Analysis for PCB Failure Investigation | Electronics Testing Support
Read moreIonic species Type Primary implication in PCB failure analysis Chloride Anion Flux activator residue, environmental chloride exposure, halogenated material contamination Fluoride Anion Specific flux formulations, etching process residues Bromide Anion Halogenated flux systems, flame retardant materials Nitrate Anion Environmental sources, cleaning chemistry Nitrite Anion Environmental sources, some process chemistry Phosphate Anion Some flux formulations, process chemical residues Sulfate Anion Environmental deposition, some flux chemistry, atmospheric contamination during storage Sodium, potassium Cation Handling contamination, process water, environmental sources Ammonium Cation No-clean flux amine activators, incompletely deactivated flux residue Calcium, magnesium Cation Process water, environmental contamination Lithium Cation Specific process chemistry, battery-related contamination Acetate, formate WOA No-clean flux activator decomposition products Citrate, malate, succinate WOA Flux chemistry residues, organic acid activators Methanesulfonate WOA Specific flux formulations Phthalate WOA Plasticiser migration, packaging contamination
Chloride is the most significant anion in PCB failure analysis. Even at low concentrations, it initiates pitting corrosion and supports dendritic growth between conductors under voltage bias. Elevated ammonium, organic amines, or WOA species such as acetate and formate indicate no-clean flux residue that has not been fully deactivated and retains corrosion-promoting properties despite a nominally clean process.
ALS Testing analyses all three ionic categories under IPC-TM-650 2.3.28: anions (chloride, fluoride, bromide, nitrate, nitrite, phosphate, sulfate), cations (ammonium, sodium, potassium, calcium, magnesium, lithium), and weak organic acids or WOA (acetate, formate, citrate, malate, succinate, methanesulfonate, phthalate). A full species profile across all three categories provides the most complete picture of contamination source and corrosion risk. IC and SEM-EDX Together in Failure Investigation Ion chromatography and SEM-EDX analysis are complementary in PCB failure investigation. Each provides information the other cannot. SEM imaging characterises the morphology of corrosion damage at the failure site: the distribution of corrosion products, the pattern of dendritic growth, the condition of solder joint surfaces, and any visible residues or contamination. EDX analysis at specific points within the corrosion zone identifies the elemental composition, which can support or question the hypothesis generated by IC results. Detecting chlorine by EDX at a corrosion site is consistent with chloride-driven corrosion. Detecting sulfur is consistent with sulfate-related attack. What EDX cannot do is quantify the contamination level across the board surface or distinguish between the many possible ionic species that contain chlorine or sulfur. IC provides that quantification and speciation, working across the full board surface rather than at specific isolated points. A complete PCB failure investigation typically uses IC to characterise the overall ionic contamination profile and identify the dominant species, and SEM-EDX to characterise the specific failure site morphology and elemental composition. Together, they provide the evidence base needed for a defensible root cause conclusion. For a broader explanation of how SEM, EDX, and FTIR contribute to failure analysis, see our guide on scanning electron microscopy analysis for failure investigation. The Extraction Method Matters The reliability of IC results in failure analysis depends on how the extraction is performed. The method must be consistent, validated, and appropriate for the investigative objective, since errors or deviations at the extraction stage propagate directly into the analytical results and can obscure or misrepresent the actual contamination state of the board. Standard procedure. IPC-TM-650 2.3.28 defines the extraction method: the board is placed in a clean vessel with 75% isopropyl alcohol and 25% deionised water, extracted at 80°C for one hour under agitation, then filtered and injected into the IC system. This dissolves ionic species from the board surface including flux residues not fully soluble in water alone. Extract as received. For failure analysis, the extraction must be performed on the assembly without prior cleaning or alteration to preserve the contamination evidence in its original state. Area-specific extraction. Where the investigation requires spatial information, a controlled volume of extraction solvent applied to a defined surface area allows IC to map where contamination is most concentrated, which can be decisive in identifying the contamination source. Limitations of IC Results in Failure Investigation IC results are powerful evidence but require careful interpretation. Three limitations apply in most failure analysis contexts. IC does not identify the responsible process step or supplier. Species identification points toward contamination sources, for example chloride toward flux residue or environmental exposure, and ammonium toward no-clean flux deactivation failure. But identifying which specific process step, supplier, or handling event introduced the contamination requires interpreting IC data in the context of the full assembly process history, materials used, handling conditions, and failure pattern. IC reflects contamination at the time of testing, not necessarily at the time of failure. In boards returned from extended service, some ionic species may have been consumed by the corrosion reactions they initiated, reducing the measured concentration below the original level. Others may have been introduced by service environment exposure after the original failure mechanism was already underway. Interpreting IC results from aged field returns requires judgement about what the data represents and what may have changed since manufacture. A single IC result has limited diagnostic power without comparison data. A contamination level that looks elevated in isolation may be normal for the process, or it may indicate a process excursion if compared against qualification data. Results from non-failed assemblies from the same production lot, or from process qualification records, provide the reference point that makes species level differences meaningful and points toward the contamination source. Frequently Asked Questions When should IC be included in a PCB failure analysis investigation? IC should be included when ionic contamination is a plausible contributor to the failure mechanism, covering most cases of corrosion, leakage current, dendritic growth, or intermittent electrical behaviour associated with humidity exposure. It should also be included when the investigation needs to differentiate between flux residue contamination and environmental contamination, since anion test species profiles typically distinguish between these sources. Can IC analysis be performed on a board that has already been through SEM examination? In most cases yes, provided the SEM examination was performed without sputter coating the board surface, and provided the board has not been cleaned or altered during the SEM investigation. Discuss the planned analytical sequence with the laboratory before any step that might affect the surface chemistry of the board. What information should I provide when submitting a failed PCB for IC analysis? The most useful information includes the assembly process description (flux type, cleaning or no-clean process), service history including environment and duration, visual or functional observations from the failure, the OEM cleanliness specification if one applies, and whether comparison samples from the same production lot are available. For no-clean assemblies, note whether WOA analysis is required alongside standard anion and cation testing, as WOA species are particularly relevant to no-clean flux residue characterisation. How does IC for failure analysis differ from routine production anion testing? The analytical method is the same. The difference is in the objective and interpretation. Production anion testing confirms ionic contamination is within the specified limit. Failure analysis IC characterises the contamination profile of a failed assembly and generates hypotheses about the source and mechanism of failure, interpreted against the full failure evidence rather than a pass or fail threshold alone. Next Steps See our full Chemical and Electronics Testing services including IC for PCB failure analysis See our Failure Analysis services including SEM-EDX for corrosion and contamination investigation Read our guide on PCB cleanliness testing and ion chromatography for production quality control context Contact our team to discuss a PCB failure analysis investigation ISO/IEC 17025 Accredited Testing Where Applicable | Anion and Cation Analysis for PCB Failure Investigation | Electronics Testing Support
August 11, 2026
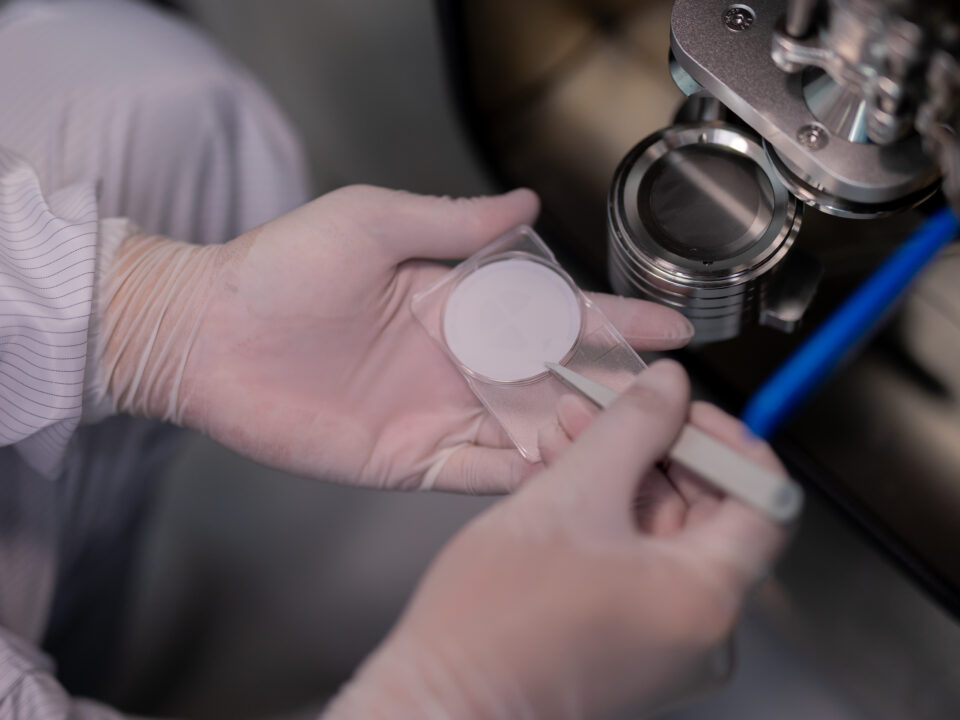
ISO/IEC 17025 Accreditation · OEM Acceptance · Analytical Breadth · Liability Protection
ISO/IEC 17025 Accredited Testing Where Applicable | Independent Third-Party Laboratory | Serving Malaysia and Southeast Asia
Outsourcing automotive testing means sending components, materials or assemblies to an accredited independent laboratory for testing that meets OEM qualification, type approval or regulatory submission requirements. In-house quality checks support production monitoring, but they cannot replace accredited third-party results where formal compliance evidence is required.
The OEM Acceptance Problem with In-House Testing
Global OEMs require test results from ISO/IEC 17025 accredited laboratories for formal qualification submissions. In-house results are not accepted as compliance evidence for OEM approval processes, type approvals or regulatory submissions. This is not a matter of trust. It is a matter of what the quality framework requires.
ISO/IEC 17025 accreditation means the laboratory has been independently assessed for technical competence, measurement traceability, equipment calibration, and quality management. ILAC MRA recognition means results are accepted by OEMs and regulatory bodies in more than 100 countries without re-validation when they cross borders or change hands in a supply chain.
For Malaysian and Southeast Asian suppliers, test reports must carry ILAC MRA recognition to be accepted by European, Japanese, or American OEMs without question.
Objectivity and Conflict of Interest
A laboratory that tests its own products has an inherent interest in the result. The structural conflict of interest is recognised by OEMs, regulators, and courts. Third-party testing removes this ambiguity. An independent laboratory has no stake in whether a result passes or fails, giving the test report its value as documentary evidence in warranty claims, liability disputes, and regulatory investigations.
Access to Analytical Breadth
Maintaining broad analytical capability in-house is expensive. An accredited contract laboratory spreads these costs across many clients, giving suppliers access to a full analytical suite through a single laboratory relationship.
SEM-EDX for failure analysis
ICP-MS and ICP-OES for chemical compliance
GC-MS for VOC testing
Ion chromatography for ionic contamination
Salt spray and environmental simulation
Particle analysis to ISO 16232 and VDA 19
When In-House Testing Still Makes Sense
In-house testing suits routine production monitoring where speed and low cost matter more than formal accreditation. The effective approach for most suppliers combines in-house methods for production monitoring with accredited third-party testing for OEM submissions, qualification programmes, and regulatory compliance.
When to Start Thinking About Third-Party Testing
A few situations signal that third-party accredited testing should be part of the plan.
New OEM relationship: qualification submissions almost always require accredited results from the outset
First PPAP submission: third-party data is typically required as part of the package
Entering a new market: EU, Japanese or American OEM supply chains each have specific accreditation requirements
Specification change: when an OEM revises a material or component specification, re-qualification with accredited data is usually triggered
Field failure or warranty claim: independent test evidence becomes critical when liability is in question
Expanding product scope: new component types may require test capabilities not available in-house
In-House vs Third-Party Testing
Testing Context
In-House
Third-Party Accredited
OEM qualification
Not accepted
Required
Regulatory submission
Not accepted
Required
Production monitoring
Suitable
Not required
Conflict of interest
Present
None
Analytical breadth
Limited
Full suite
Cost per test
Lower
Higher
The Liability Argument
An accredited third-party test report is a contemporaneous, independent record of a component’s condition at the time of manufacture. It demonstrates the product was tested against defined requirements by an independent organisation. An internal record carries less weight in a dispute because the party that produced it had an interest in the outcome.
Choosing the Right Laboratory Partner
Not all accredited laboratories are equal in scope or capability. ISO/IEC 17025 accreditation covers only the specific methods formally assessed, so confirm the exact method and scope before testing begins.
ALS Testing is an independent, ISO/IEC 17025 accredited laboratory serving OEMs, Tier-1 and Tier-2 suppliers in Malaysia and Southeast Asia. Accredited results are accepted by OEMs and regulatory authorities in more than 100 countries under the ILAC MRA.
Frequently Asked Questions
When does my OEM actually require results from an accredited laboratory?
For formal qualification, type approval and regulatory compliance declarations, most global OEMs require ISO/IEC 17025 accredited results with ILAC MRA recognition. For routine production monitoring, accredited results are generally not required. Review your OEM specification or PPAP requirements to confirm.
Can we use our in-house results for any formal OEM submission?
In most cases, no. OEM qualification and formal approval submissions require independently accredited test data. If your specification is not explicit on this point, confirm with your OEM customer quality team before preparing the submission.
How do we manage the turnaround time for third-party testing against production schedules?
Build testing into the programme schedule from the outset rather than treating it as a final step. For urgent requirements, discuss expedited service options with your laboratory at the enquiry stage.
Is there a cost saving from consolidating testing with one laboratory?
In most cases, yes. A single laboratory covering multiple disciplines reduces logistics complexity, simplifies sample management and often results in volume-based cost efficiencies.
Next Steps
Back to Automotive Testing for the full service overview
Review our laboratory accreditation scope
Contact our team to discuss your testing requirements and receive a quotation at /contact/
ISO/IEC 17025 Accredited Testing Where Applicable | ILAC MRA Recognised | Independent Third-Party Automotive Testing
Read moreAugust 11, 2026
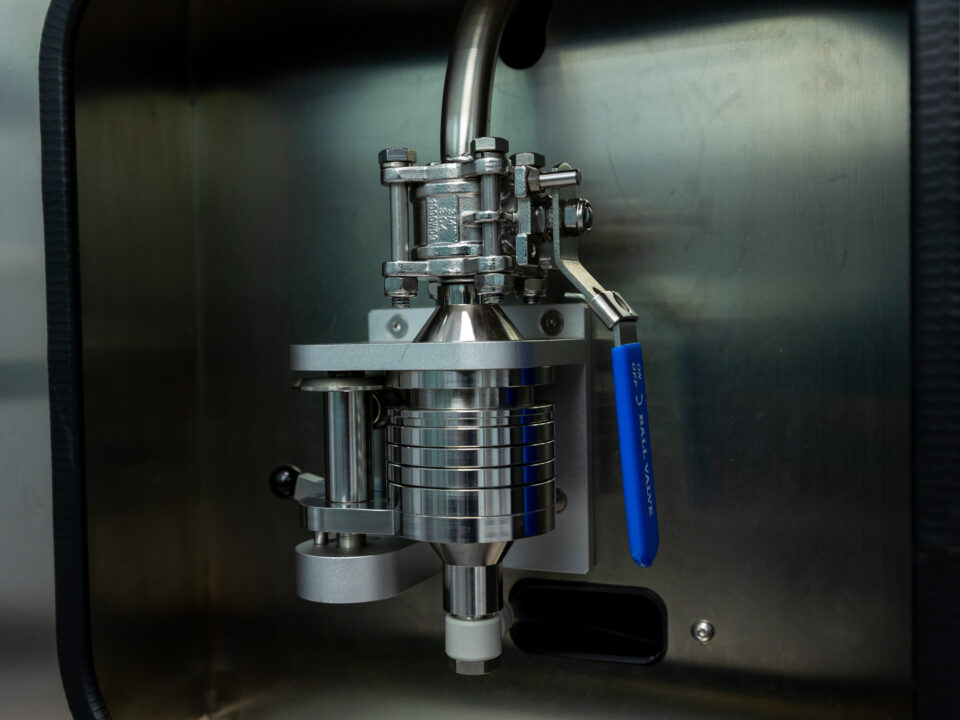
Particle Extraction · Gravimetric Analysis · LPC Counting · Microscopic Classification · SEM-EDX Particle Identification
ISO/IEC 17025 Accredited Testing Where Applicable | VDA 19 and ISO 16232 Capability | Automotive Cleanliness Specialist
An OEM drawing specifies a cleanliness class. A customer’s purchase order references VDA 19. This guide walks through the VDA 19.1 test process step by step, from the first blank test to the final cleanliness report, and explains where VDA 19.2 fits.
VDA 19 and What It Covers
VDA 19 is the German automotive industry standard for technical cleanliness testing, published by the VDA (Verband der Automobilindustrie). It is required by German OEMs including BMW, Volkswagen Group and Mercedes-Benz, and by the Tier-1 suppliers that serve them.
VDA 19 Part 1 covers particle contamination analysis of automotive components: extraction, counting, classification and reporting. This is the part that applies when a customer or OEM specifies VDA 19 for a laboratory submission.
VDA 19 Part 2 covers technical cleanliness requirements for assembly environments. It is applied in the production facility, not the testing laboratory.
The step-by-step process in this guide covers VDA 19 Part 1. For a comparison with ISO 16232, which is technically harmonised with VDA 19 Part 1 for most applications, see our guide on ISO 16232 vs VDA 19.
The VDA 19.1 Test Process
Blank test and environment verification
Component inspection and documentation
Extraction method selection and validation
Filtration onto a membrane
Gravimetric analysis
Light obscuration particle counting (LPC)
Microscopic particle classification
Cleanliness classification and reporting
Where an OEM specification requires it, SEM-EDX particle identification is applied to specific particles on the membrane before the final report is issued.
Blank Test and Environment Verification
No component is extracted until the test environment and all extraction equipment are verified to be clean.
The blank test runs the complete extraction process, covering solvents, vessels and filtration equipment, without a component present. The result establishes the background contamination level. VDA 19 requires that blank contamination stays below defined limits before component testing proceeds. If the blank level is too high, the contamination source must be identified and eliminated before the test is valid.
Step 1 Component Inspection and Documentation
Before extraction begins, the component is inspected and documented as received. Sample condition, including any visible contamination, damage or packaging concerns, is recorded photographically and in writing.
This provides a baseline if questions arise about whether the result reflects manufacturing cleanliness or contamination introduced during handling or shipping. Samples showing evidence of post-manufacture contamination may require discussion with the client before testing proceeds.
Step 2 Extraction Method Selection and Validation
Extraction method
How it works
Best suited for
Pressure rinsing
Filtered solvent forced through internal channels under controlled pressure
Bores, galleries and flow paths, such as hydraulic valves and fuel rails
Ultrasonic extraction
Component submerged in solvent bath, ultrasonic energy dislodges particles
Complex surfaces and recesses inaccessible by direct rinsing
Agitation
Component immersed in solvent and agitated mechanically
Simple geometry with open, accessible internal spaces
Air jet extraction
Directed air stream dislodges particles, captured for analysis
Components that must not contact liquid
Where the method is not specified, the laboratory selects and documents the most appropriate option. Efficiency is validated by repeated cycles until the particle count confirms a declining curve, demonstrating substantially complete contamination removal.
Step 3 Filtration
After extraction, the solvent carrying the extracted particles passes through a membrane filter with a defined pore size, typically 5 micrometres. Particles are collected on the membrane surface.
The membrane is then conditioned, dried and equilibrated to stable temperature and humidity, in preparation for weighing and optical examination. Membrane type, pore size and filtration conditions are documented as part of the test record.
Step 4 Gravimetric Analysis
The dried membrane is weighed on a calibrated analytical balance before and after filtration. The mass difference is the total gravimetric contamination.
Gravimetric analysis is fast and is a required element of the VDA 19 test programme. Its limitation is functional: a component can carry a single oversized particle posing significant risk while still showing a low gravimetric result. This is why it is used alongside, not instead of, particle counting and classification.
Step 5 Light Obscuration Particle Counting (LPC)
The extracted particles are re-suspended in clean solvent and passed through a laser-based particle counter, which counts and sizes each particle individually.
LPC produces a count distributed across defined size classes, from the lower threshold up through multiple ranges to particles above 1,000 micrometres. LPC is the method that determines whether a component meets its specified cleanliness class. A component with low total particle mass may still exceed the limit in a specific size class if a small number of large particles are present. The size distribution, not just the total count, is what the specification controls.
Step 6 Microscopic Particle Classification
After LPC, particles on the membrane are examined under a calibrated microscope and classified into the categories defined by VDA 19.
Particle category
Appearance
Typical source
Why it matters
Shiny (metallic)
Reflective under incident light
Machined metal debris
Wear particles
Casting residue
Highest mechanical damage risk, often a critical specification limit
Non-shiny
Not reflective
Rubber
Polymer
Ceramic
Mineral debris
Oxidised metal
Risk depends on size, hardness and application
Fibres
Elongated, per the standard’s length-to-width criterion
Packaging
Cleaning materials
Textile components
Assessed separately from hard particles
A shiny metallic particle above a defined size is often a non-conformance regardless of total count, and some OEM specifications subdivide these categories further per the cited edition and specification. Significant particles are recorded with images alongside the count data.
Step 7 SEM-EDX Particle Identification (Where Required)
SEM-EDX identifies specific particles on the membrane when particle identity must be confirmed or an OEM specification requires elemental identification above a defined size. SEM images particle morphology, EDX identifies elemental composition, distinguishing materials such as iron from aluminium, or ceramic, glass and polymer particles.
This supports contamination source investigation and is required by some OEM specifications for certain particle types or sizes. Confirm with your laboratory at the enquiry stage if SEM-EDX is required.
Step 8 Cleanliness Classification and Reporting
Gravimetric, LPC, and microscopic results combine into the Component Cleanliness Code (CCC), VDA 19’s standardised output. The CCC is expressed as letter-number pairs covering size range and count level, with lower numbers indicating fewer particles, and is assessed against OEM or customer limits for pass or fail determination.
Notation and size classes follow the applicable standard, OEM specification, or customer template. The CCC is not universal across all specifications.
The final report documents extraction method, blank test results, gravimetric mass, LPC size distribution, microscopic classification with images, and final cleanliness class.
Where VDA 19 Part 2 Fits
VDA 19 Part 2 covers technical cleanliness in assembly environments, workstations, tooling, fixtures, packaging and handling areas. Its purpose is to prevent new contamination during assembly that would compromise the cleanliness verified by Part 1 testing.
It is applied in the production facility, not the testing laboratory, and is a separate requirement from component cleanliness testing. Confirm the specific requirement with your OEM or customer.
Sample Submission Requirements
Standard: VDA 19 Part 1 or ISO 16232, and the applicable edition
Cleanliness class: or the particle count limits that apply
Controlled surface: the wetted surface defined in the drawing
Drawing: number and revision
Extraction method: if specified by the OEM or customer
SEM-EDX: whether particle identification is required
Quantity: number of samples to submit
Report format: required template or OEM format
Package components in clean, sealed polythene bags immediately after manufacture and keep them sealed until laboratory receipt. Avoid paper or cardboard in direct contact with component surfaces, as fibres can transfer and affect the result.
Frequently Asked Questions
What is the difference between VDA 19 and ISO 16232?
VDA 19 Part 1 and ISO 16232 are technically harmonised. The main difference is in reporting format, cleanliness class notation and who requires which standard. German OEMs specify VDA 19, while most other global OEMs reference ISO 16232.
How do I know which extraction method will be used for my component?
The extraction method is selected based on component geometry and surfaces of interest. If your OEM specification defines a required method, that method is applied. If not, the laboratory selects the most appropriate method and documents the rationale.
Do I need SEM-EDX particle identification as part of my VDA 19 test?
Not always. SEM-EDX is required when an OEM specification calls for elemental identification of particles or when a contamination source investigation requires material identification. For standard cleanliness class determination, gravimetric, LPC and microscopic classification are typically sufficient.
How should I package and ship components for VDA 19 testing?
Seal components in clean polythene bags immediately after manufacture and keep them sealed until laboratory receipt. Avoid paper or cardboard packaging in direct contact with component surfaces.
Does VDA 19 Part 2 apply to my laboratory test?
No. Part 2 covers assembly environment cleanliness and is applied in the production facility. Laboratory component testing is covered by Part 1.
Request a VDA 19 Testing Quote
ALS Testing provides technical cleanliness testing to VDA 19 Part 1 and ISO 16232 for automotive components across hydraulic, fuel, braking, transmission and EV powertrain applications. Testing under ISO/IEC 17025 accreditation is available where covered by the applicable accredited scope.
Next Steps
See our full Technical Cleanliness Testing services
Read our guide comparing ISO 16232 and VDA 19
Read our guide on particle extraction methods
Contact our team for a VDA 19 testing quotation or technical discussion at Contact us – alstesting.co.th
ISO/IEC 17025 Accredited Testing Where Applicable | VDA 19 and ISO 16232 Capability | SEM-EDX Particle Identification Available
Read moreAugust 10, 2026
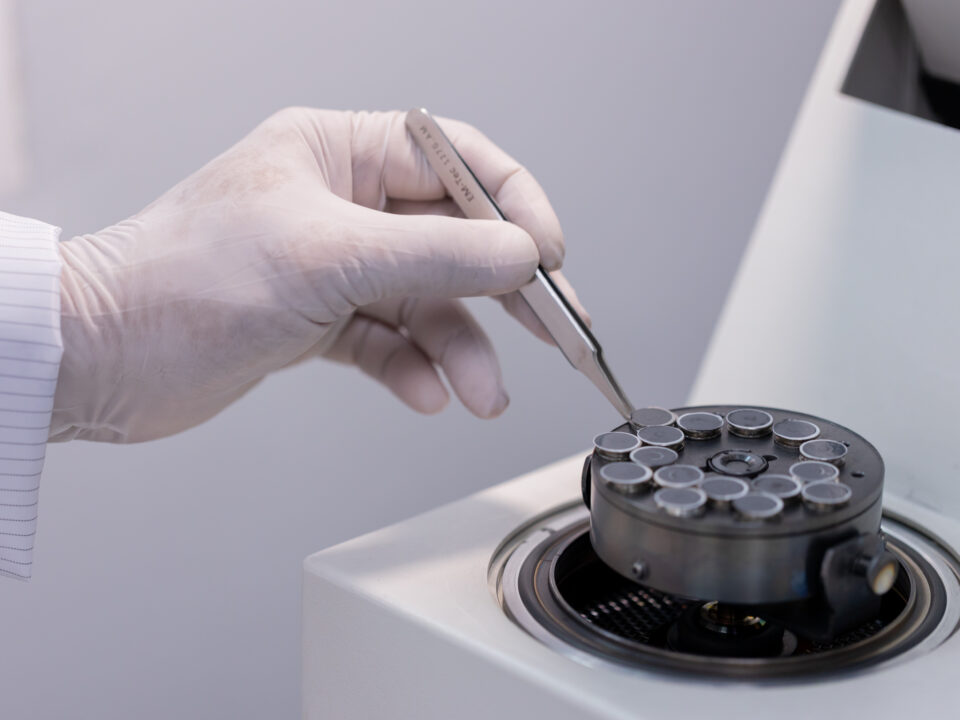
RoHS Screening · REACH SVHC · IEC 62321 · XRF Screening · ICP-MS Confirmatory Analysis · GCMS Phthalate Testing
ISO/IEC 17025 Accredited Testing Where Applicable | RoHS and REACH Compliance Capability | Chemical and Electronics Testing
A PCB assembly destined for the EU market must not contain lead above defined limits. A sensor housing must not incorporate hexavalent chromium in its plating. A wiring harness component must not include any of the four restricted phthalates in its insulation material above threshold concentrations.
These requirements come from RoHS. For automotive electronics suppliers, compliance is not self-certifiable without analytical evidence from a testing laboratory.
What RoHS Requires
The RoHS Directive (2011/65/EU, amended by 2015/863/EU) restricts ten hazardous substances in electrical and electronic equipment placed on the EU market. Each must not exceed defined concentration thresholds in any homogeneous material within the product.
Substance
Threshold
Typical Location in Electronics
Lead (Pb)
0.1%
Solder, coatings, stabilisers
Mercury (Hg)
0.1%
Switches, lamps
Cadmium (Cd)
0.01%
Plating, stabilisers
Hexavalent chromium Cr(VI)
0.1%
Surface treatments, coatings
Polybrominated biphenyls (PBB)
0.1%
Flame retardants in polymers
Polybrominated diphenyl ethers (PBDE)
0.1%
Flame retardants in polymers
DEHP
0.1%
Plasticiser in PVC insulation
BBP
0.1%
Plasticiser in polymers
DBP
0.1%
Plasticiser in polymers
DIBP
0.1%
Plasticiser in polymers
Automotive equipment is subject to a range of exemptions where no technically feasible substitute currently exists. Exemptions are defined in annexes to the directive and reviewed periodically. If your product qualifies for an exemption, confirm the exemption number and its current expiry date before relying on it in a compliance declaration.
REACH and SVHC Obligations
REACH requires suppliers to communicate information about SVHC present above 0.1% by weight on request. Where SVHC exceeds 0.1% in articles placed on the EU market above one tonne per year, notification to ECHA is also required. The candidate list contains more than 230 substances and is updated twice a year. RoHS and REACH have different substance lists, thresholds, and compliance mechanisms. A PCB may need to satisfy both.
IEC 62321 Testing Methods for PCBs and Automotive Electronics
IEC 62321 is the standard series defining analytical methods for RoHS substance determination. Testing follows a staged approach: XRF screening first, then confirmatory quantitative analysis where screening indicates a potential exceedance.
Substance / Group
Technique
Stage
Lead, Mercury, Cadmium, Chromium (total)
XRF
Screening
Lead, Mercury, Cadmium
ICP-MS (IEC 62321-4)
Confirmatory
Total Chromium
ICP-OES (IEC 62321-5)
Confirmatory pre-step
Hexavalent chromium Cr(VI)
UV-Vis spectrophotometry (IEC 62321-7-2)
Confirmatory
PBB, PBDE
XRF then GCMS (IEC 62321-6)
Screening then Confirmatory
Phthalates (DEHP, BBP, DBP, DIBP)
GCMS (IEC 62321-8)
Confirmatory
Applying IEC 62321 to Automotive PCBs & What Gets Tested
The RoHS threshold applies per homogeneous material, not per product. A complete compliance assessment covers multiple materials within the same component. Key material categories and their primary compliance risks
Solder materials: assessed for lead content. Lead-free transition is mandated for most applications, but automotive-specific exemptions remain under periodic review.
Connector contacts and metal housings: assessed for cadmium plating and hexavalent chromium surface treatments.
Polymer insulation, cable jacketing, and housings: assessed for PBB, PBDE, and phthalate content by GCMS.
PCB laminates: assessed for bromine-containing flame retardants by XRF, with GCMS confirmation where indicated.
Coatings and surface finishes: assessed for hexavalent chromium, cadmium, and lead depending on treatment type.
REACH SVHC screening: scope is determined by the bill of materials and the SVHC categories most likely to apply.
Submitting a bill of materials alongside your samples allows the laboratory to define the most efficient screening programme and avoid unnecessary confirmatory testing.
Frequently Asked Questions
Does RoHS apply to automotive electronics sold outside the EU?
RoHS applies to equipment placed on the EU market. However, most global OEMs apply it as a supply chain requirement regardless of target market, because non-compliant components create risk if market destinations change. Confirm the applicable scope with your customer. Is XRF alone sufficient for a RoHS compliance declaration?
No. XRF is a screening tool only. Where XRF indicates a potential exceedance, confirmatory analysis by ICP-MS, ICP-OES, GCMS, or UV-Vis must follow depending on the substance. A compliance declaration based on XRF screening alone is not analytically defensible. How often does REACH SVHC screening need to be repeated?
The SVHC candidate list is updated typically twice a year. An assessment against an earlier version may not cover newly listed substances. Monitor ECHA updates and assess newly listed substances against your bill of materials on a rolling basis. What should I provide when submitting for RoHS testing? Bill of materials broken down by homogeneous material where possible Target market and any exemptions being claimed, with exemption number and expiry date Whether XRF screening only or full confirmatory analysis is required OEM compliance declaration format if a specific template is required RoHS and REACH Testing at ALS ALS Testing provides RoHS compliance screening and REACH SVHC assessment for automotive PCBs, connectors, sensors, and materials. Our testing programme follows IEC 62321 analytical methods, with XRF screening and confirmatory analysis by ICP-MS, ICP-OES, GCMS, UV-Vis, and ion chromatography depending on the substance group. ISO/IEC 17025 accredited testing is available where covered by our accredited scope. Next Steps See our full Chemical and Electronics Testing services Back to Automotive Testing Contact our team for a compliance testing quotation or technical discussion at Contact us – alstesting.co.th ISO/IEC 17025 Accredited Testing Where Applicable | RoHS and REACH SVHC Screening | IEC 62321 Analytical Methods
Read moreRoHS applies to equipment placed on the EU market. However, most global OEMs apply it as a supply chain requirement regardless of target market, because non-compliant components create risk if market destinations change. Confirm the applicable scope with your customer. Is XRF alone sufficient for a RoHS compliance declaration?
No. XRF is a screening tool only. Where XRF indicates a potential exceedance, confirmatory analysis by ICP-MS, ICP-OES, GCMS, or UV-Vis must follow depending on the substance. A compliance declaration based on XRF screening alone is not analytically defensible. How often does REACH SVHC screening need to be repeated?
The SVHC candidate list is updated typically twice a year. An assessment against an earlier version may not cover newly listed substances. Monitor ECHA updates and assess newly listed substances against your bill of materials on a rolling basis. What should I provide when submitting for RoHS testing? Bill of materials broken down by homogeneous material where possible Target market and any exemptions being claimed, with exemption number and expiry date Whether XRF screening only or full confirmatory analysis is required OEM compliance declaration format if a specific template is required RoHS and REACH Testing at ALS ALS Testing provides RoHS compliance screening and REACH SVHC assessment for automotive PCBs, connectors, sensors, and materials. Our testing programme follows IEC 62321 analytical methods, with XRF screening and confirmatory analysis by ICP-MS, ICP-OES, GCMS, UV-Vis, and ion chromatography depending on the substance group. ISO/IEC 17025 accredited testing is available where covered by our accredited scope. Next Steps See our full Chemical and Electronics Testing services Back to Automotive Testing Contact our team for a compliance testing quotation or technical discussion at Contact us – alstesting.co.th ISO/IEC 17025 Accredited Testing Where Applicable | RoHS and REACH SVHC Screening | IEC 62321 Analytical Methods