

Particle Analysis for Automotive Manufacturing, Methods, Standards and Applications

Scanning Electron Microscopy Analysis for Failure Analysis: SEM, FTIR, Cross-Section and Root Cause Investigation
June 30, 2026
Automotive Materials Testing, VDA 278, VOC Emissions and Interior Air Quality
August 10, 2026Particle Analysis for Automotive Manufacturing, Methods, Standards and Applications
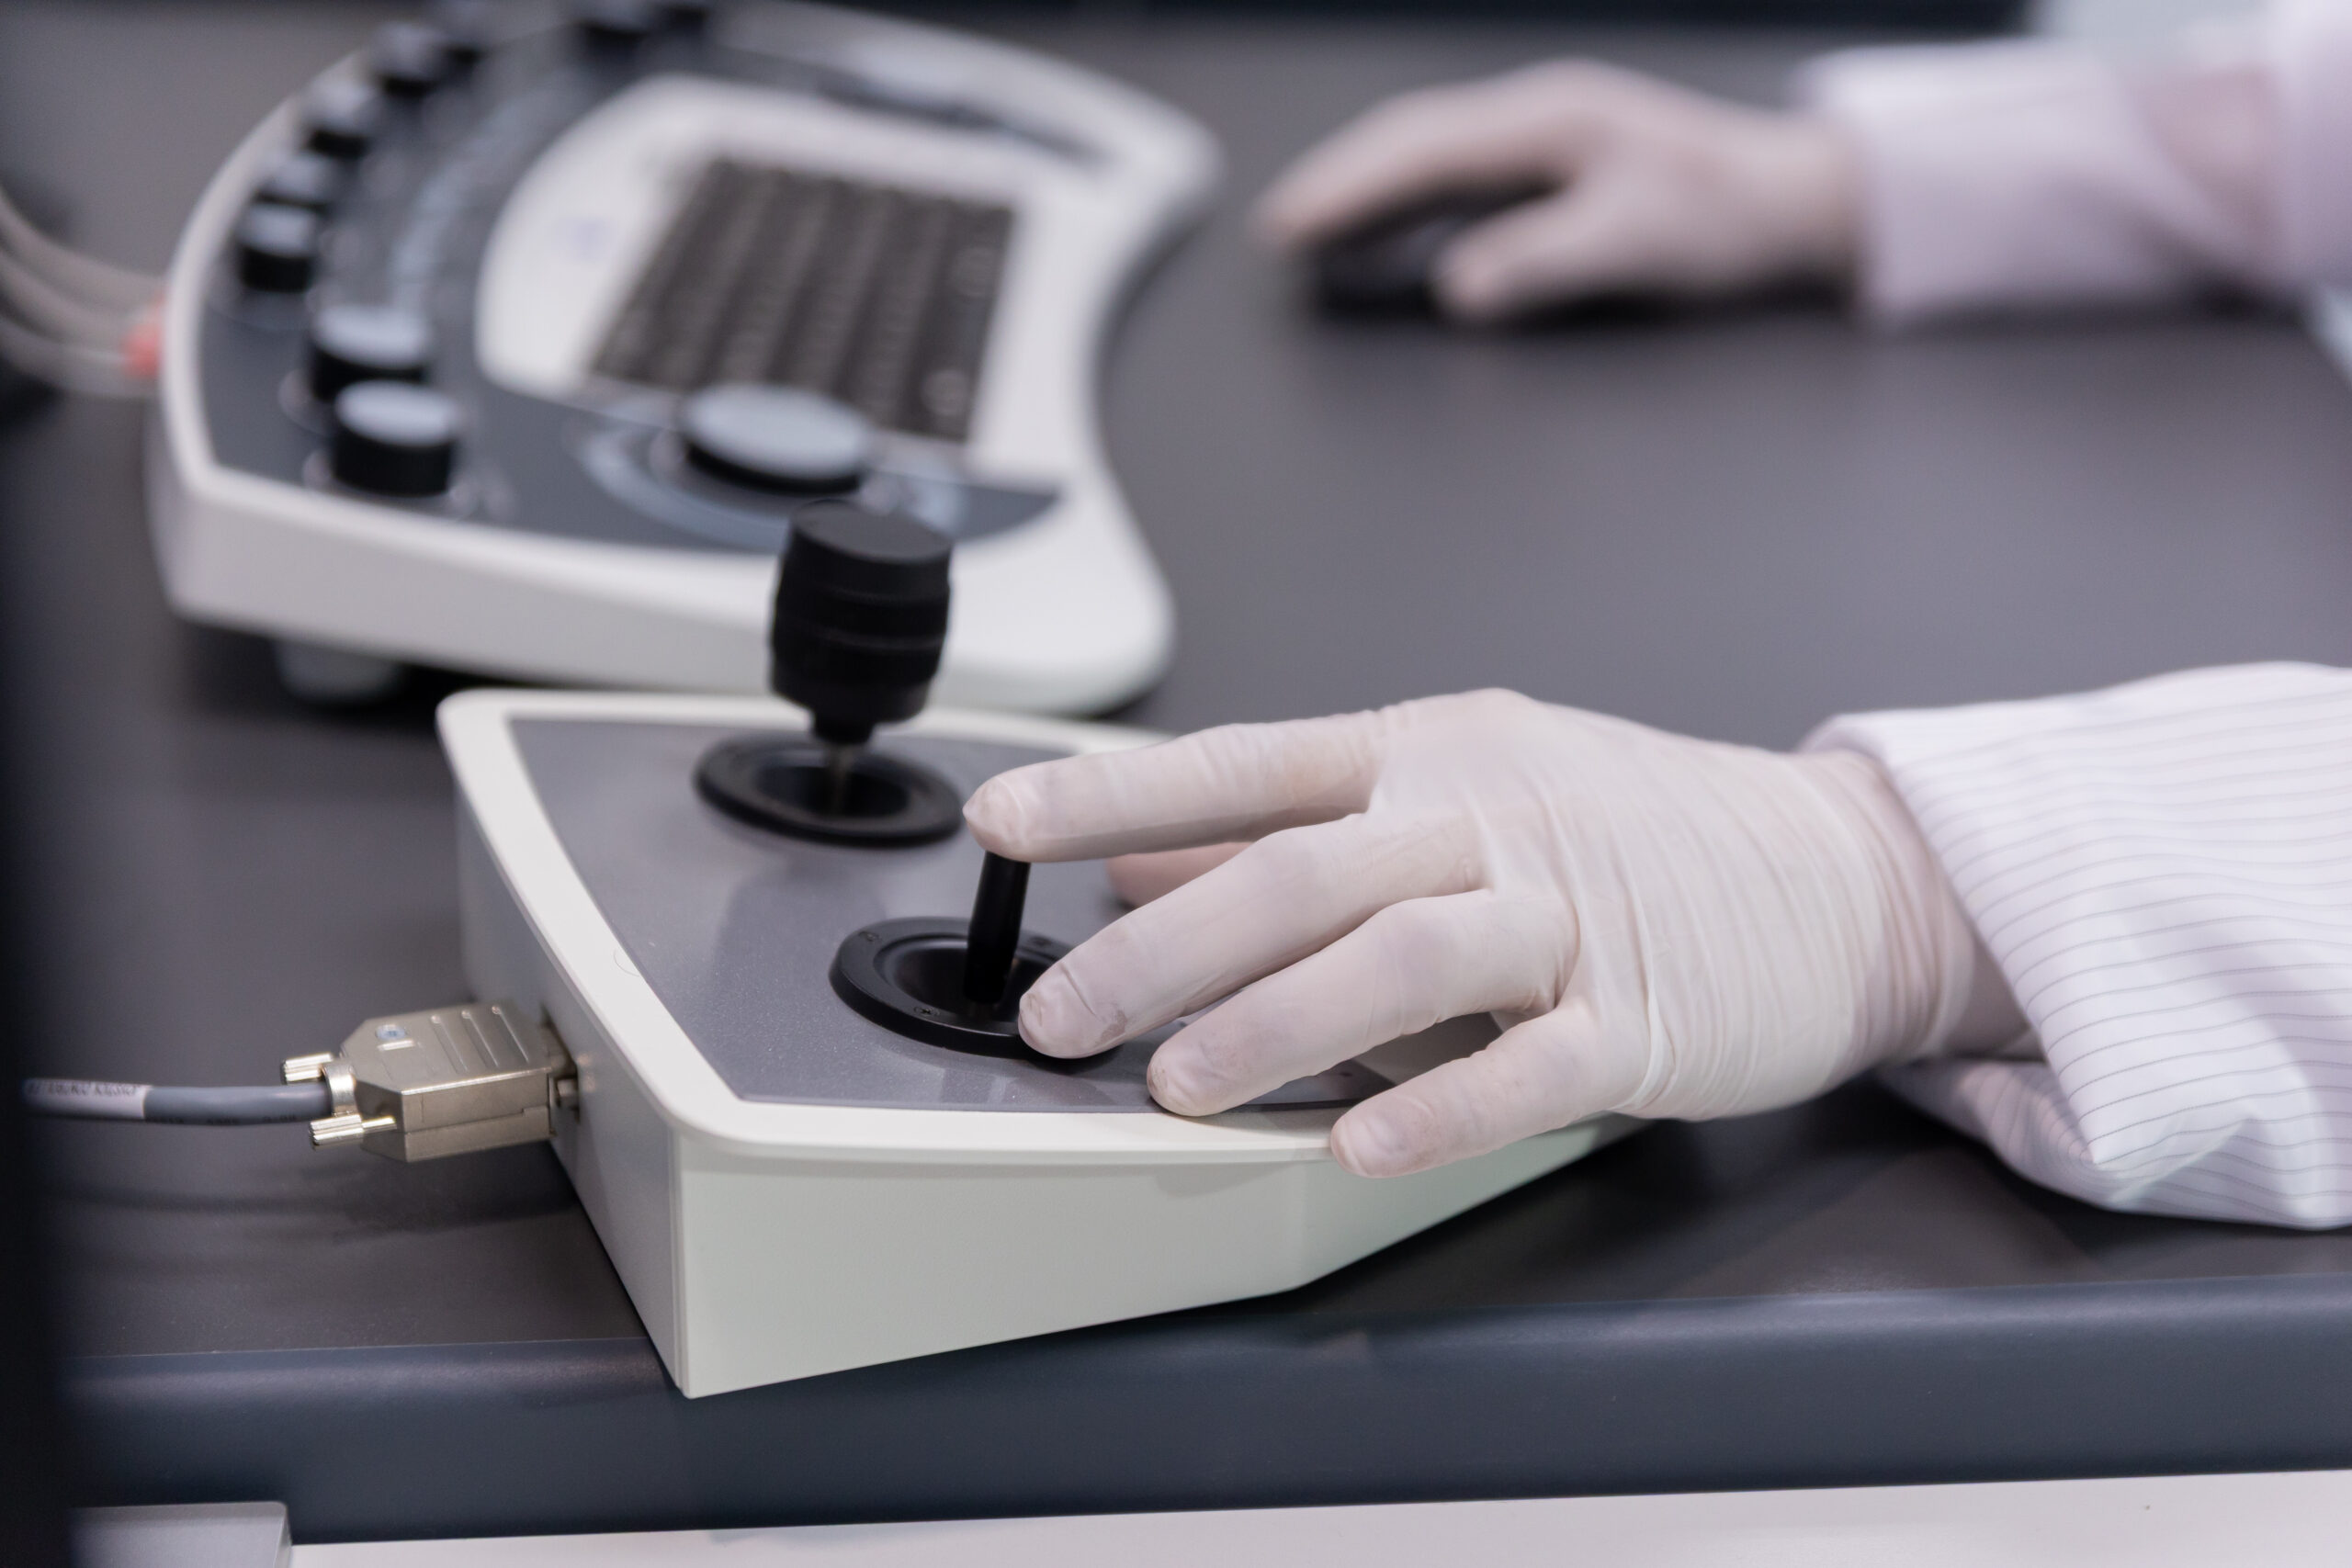
Particle Extraction · Gravimetric Analysis · Microscopic Sizing and Counting · Particle Classification · SEM-EDX Identification
ISO/IEC 17025 Accredited Testing Where Applicable | Automotive Cleanliness Workflow | Automotive Specialist
A particle smaller than a tenth of a millimetre can affect a hydraulic valve, score a fuel injector nozzle, or interfere with a narrow control orifice. The risk depends on the component, the clearance, the material, and the cleanliness limit defined by the OEM or customer specification.
In automotive manufacturing, particle analysis is a technical cleanliness workflow used to extract, count, size, classify and identify particulate contamination on automotive components. It helps manufacturers understand how much contamination is present, how large the particles are, and what materials they are made of.
The results are commonly used for components where particles may affect hydraulic flow, fuel injection, lubrication, cooling, sealing or electronic reliability, then compared against ISO 16232, VDA 19.1, OEM specifications or customer cleanliness limits.
What Is Particle Analysis
A complete particle analysis workflow usually looks at three practical areas.
| What the test checks | Why it matters |
| Total particle mass | Shows the overall contamination load on the component |
| Particle count and size distribution | Shows whether particles exceed the defined size or count limits |
| Particle type or material | Helps identify whether the contamination is metallic, non-metallic, fibrous, organic, mineral or another material type |
No single measurement gives the full picture. A component may have a low total particle mass but still contain one large metallic particle that could interfere with a valve or precision bore. Another component may have many small particles but still remain within the agreed cleanliness requirement. Particle analysis combines mass, size distribution and particle type so that manufacturers and OEMs can evaluate cleanliness against a defined specification.
For a full comparison of how cleanliness requirements are handled under the two main automotive cleanliness frameworks, see our companion article on ISO 16232 vs VDA 19.
How the Particle Analysis Workflow Works
Particle analysis is not a single test. It is a controlled workflow that moves from extraction to quantification, characterisation and reporting.
| Stage | What happens | Main output |
| Extraction | Particles are removed from the component using a controlled method | Extracted particles in liquid or on a collection medium |
| Quantification | Particles are weighed, counted and measured | Particle mass, count and size distribution |
| Characterisation | Particles are classified or identified by material type | Metallic, non-metallic, fibre, polymer, mineral or elemental information |
| Reporting | Results are compared with the specified cleanliness requirement | Cleanliness code, particle limits or customer report format |
This workflow is applied to functionally relevant surfaces, internal channels and component areas where contamination could affect performance, reliability or acceptance by the customer.
Particle Extraction Methods
Before particles can be counted or identified, they must be removed from the component in a controlled way. The purpose of extraction is to collect contamination from the relevant surfaces without adding particles from the test environment, solvent, equipment or handling process.
The extraction method depends on component geometry, surface condition, component weight, cleanliness requirement and whether the component can safely contact liquid.
| Extraction method | Use when | Notes |
| Agitation | Components with simple shapes and open internal cavities | Useful for accessible surfaces and parts that can tolerate immersion |
| Pressure rinsing | Relevant surfaces or channels can be reached by controlled liquid flow | Suitable for defined flow paths, surfaces and internal areas |
| Ultrasonic extraction | The component has complex surfaces, recesses or difficult geometry | Helps dislodge particles from areas that direct rinsing may not reach |
| Air jet extraction | The component should not contact liquid | Used only when particles can still be captured and controlled for analysis |
Before an extraction method is used for production testing, it should be validated for the component and requirement. A declining extraction curve is commonly used to show that repeated extraction cycles produce a decreasing particle count. This helps confirm that the method is removing the available contamination rather than leaving a significant unmeasured residue.
A blank value test is also important. It checks the cleanliness of the extraction equipment, solvent, membrane and test environment before the component result is interpreted. If the blank value is too high, the result may be distorted by particles introduced during the test process rather than particles from the component itself.
Particle Quantification Methods
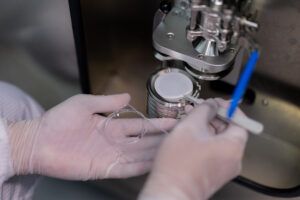
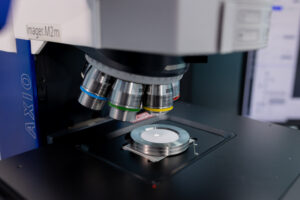
After extraction, the liquid is filtered through a membrane so that particles can be collected and analysed. In the ALS workflow shown in the reference material, the analysis includes gravimetric measurement and microscopic sizing and counting on the filter membrane.
| Method | What it measures | Why it matters | Limitation |
| Gravimetric analysis | Total mass of particles collected on the membrane | Gives a fast overall contamination index | Does not show particle size distribution |
| Microscopic sizing and counting | Particle count and size range on the filter membrane | Shows whether particles exceed count or size limits | Requires a validated microscope and image analysis method |
| Liquid particle counting where specified | Particles suspended in liquid | May be used when the customer or method requires it | Should not be confused with membrane-based microscopic counting |
Gravimetric analysis is useful because it shows the overall contamination load. However, mass alone does not show whether the contamination comes from many small particles or one oversized particle. This matters because a single large metallic particle can create more functional risk than a higher number of smaller particles within specification.
Microscopic sizing and counting addresses this gap. The filter membrane is examined using a calibrated microscope and image analysis system. Particles are counted, measured and grouped into defined size ranges. This provides the size distribution data needed to evaluate the component against the cleanliness code or particle count limits defined by the customer, ISO 16232, VDA 19.1 or the relevant reporting template.
Particle Characterisation and Material Identification
Quantification shows how many particles are present and how large they are. Characterisation helps explain what the particles are and where they may have come from.
| Particle or method | What it indicates | Why it matters |
| Metallic shiny particles | Possible machining, cutting, wear or metallic debris | Important for wear, scoring, valve sticking and possible electrical concerns |
| Non-metallic or non-shiny particles | Polymer, rubber, mineral, oxide-coated material or residue | Helps separate metallic debris from other process or handling contamination |
| Fibres | Packaging, wipes, clothing, handling or the production environment | Useful for tracing contamination from handling or packaging steps |
| SEM-EDX | Elemental composition of a particle | Helps distinguish iron, aluminium, stainless steel, glass, ceramic or mineral particles |
| FTIR | Organic or polymer-based material type | Useful for plastics, elastomers, oil, residue or organic contamination |
Fibre classification should follow the applicable inspection specification. In the ALS example report, fibres are treated as non-metallic particles with a length-to-width ratio greater than 20, the maximum diameter ≤ 50 µm. Other standard editions or customer specifications may use different fibre measurement criteria.
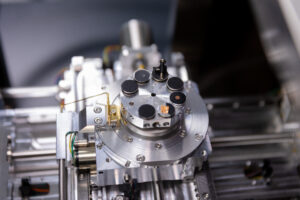
Where the exact identity of a particle must be confirmed, SEM-EDX can provide elemental composition data. FTIR may also be used when the particle is organic or polymer-based. These methods are especially useful when particle analysis is used not only for cleanliness classification, but also for contamination source investigation.
How Particle Analysis Results Are Reported
Particle analysis results are usually reported as a cleanliness result showing particle count, particle size range and sometimes particle type. In many automotive cleanliness reports, this is expressed as a Component Cleanliness Code. The exact notation depends on the ISO 16232 edition, VDA 19.1 edition, OEM specification or customer reporting template.
A Component Cleanliness Code gives OEMs, suppliers and laboratories a shared way to communicate the particle profile of a component. The code groups particles into defined size ranges and assigns a cleanliness level for each range.
Example
CCC = A (B11/C9/D7/E6/F3/G0/H1/I00/J00/K00)
In this example, each letter represents a particle size range and each number indicates the count level found in that range. Lower numbers generally indicate fewer particles in that size class.
The exact notation, size classes and upper size ranges should always follow the applicable standard edition, OEM specification or customer reporting template. Some reports may use B to K notation, while other specifications or standard updates may use extended ranges. For this reason, the code should be treated as a reporting example rather than a universal format for every cleanliness inspection.
The measured cleanliness result is then compared against the customer requirement, drawing, purchase specification or internal quality limit. This gives the manufacturer a clearer basis for release, investigation, supplier qualification or corrective action.
Where Particle Analysis Matters Most
Particle analysis is most valuable for components where particulate contamination has a direct path to functional failure.
| Application area | Typical risk | Why particle analysis helps |
| Hydraulic systems | Sticking valves, scoring, leakage or restricted flow | Checks particles in narrow passages and precision clearances |
| Fuel injection systems | Nozzle damage, spray disruption or flow concern | Detects oversized or hard particles before assembly |
| Transmission and lubrication components | Wear in oil passages, bearings or moving interfaces | Supports process control and supplier qualification |
| Cooling and thermal management components | Flow restriction, sealing issue or thermal transfer concern | Useful for EV and high-precision cooling circuits |
| Power electronics and electronic assemblies | Insulation risk, bridging or process contamination | Particle type can matter as much as particle size |
Particle analysis is also useful during supplier qualification, process validation, field failure investigation and production change control. If a machining process, washing process, packaging material or assembly step changes, particle analysis can help confirm whether the change has affected cleanliness.
Frequently Asked Questions
What is the difference between particle analysis and visual cleanliness inspection
A visual cleanliness inspection can identify visible contamination, but it cannot measure particle count, size distribution, mass or material composition with the same level of detail. Particle analysis is a controlled laboratory process that produces quantitative cleanliness data for OEM review, supplier quality requirements and process investigation.
Can particle analysis identify the source of contamination
Particle analysis can provide strong evidence about possible contamination sources. Metallic shiny particles may point to machining or wear. Fibres may point to packaging, wiping materials, clothing or handling. SEM-EDX and FTIR can provide more detailed material information. Definitive source attribution may still require a broader failure analysis or process investigation.
Do all automotive components require particle analysis
No. Particle analysis is applied selectively to components where particulate contamination creates a defined functional or quality risk. This often includes components with narrow fluid channels, precision clearances, sealing surfaces, hydraulic passages, fuel pathways, cooling circuits or sensitive electronic areas. If an OEM drawing or customer specification defines a cleanliness requirement, particle analysis may be needed to verify compliance.
Is particle analysis always covered by ISO/IEC 17025 accreditation
Not necessarily. ISO/IEC 17025 accreditation applies to specific methods within a laboratory’s accredited scope. Some parts of the workflow may be accredited, while additional particle classification, SEM-EDX, FTIR or source investigation may be reported as supporting analysis depending on the laboratory scope and customer requirement. For formal submissions, the applicable scope should be confirmed before testing.
Request a Particle Analysis Quote
Whether you are establishing a cleanliness testing programme for a new component, investigating contamination from a production process, or qualifying a supplier against an OEM cleanliness requirement, ALS Testing can support particle analysis for automotive components.
What to prepare before submitting samples
- Applicable standard or customer specification
- Cleanliness limit or required Component Cleanliness Code
- Component drawing and material information
- Critical surfaces or internal channels to be assessed
- Sample quantity and production condition
- Packaging condition and handling requirements
- OEM report template where applicable
Testing under ISO/IEC 17025 accreditation is available where covered by the applicable accredited scope. Additional particle identification support such as SEM-EDX or FTIR can be included where required by the customer specification or investigation objective.
Next Steps
- See our full Technical Cleanliness Testing services for automotive components at https://www.alstesting.co.th/technical-cleanliness-testing/
- Read our companion guide comparing the two governing standards ISO 16232 vs VDA 19
- For a deeper look at particle size distribution and cleanliness classification, see our explainer on Particle Size Analysis
- Contact our team for a particle analysis quotation or technical discussion at https://www.alstesting.co.th/contact-us/
ISO/IEC 17025 Accredited Testing Where Applicable | Extraction, Microscopic Counting and Particle Identification Support | Automotive Cleanliness Testing

