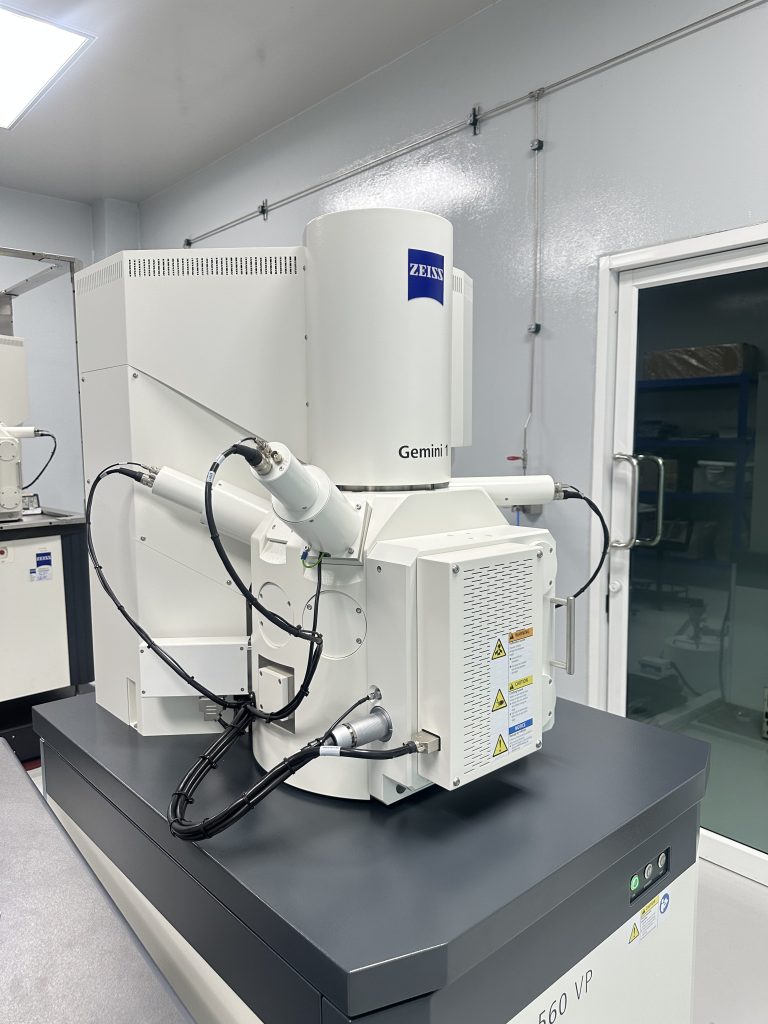
sem-edx
- โชว์สินค้าทั้งหมด
- No categories
May 13, 2026
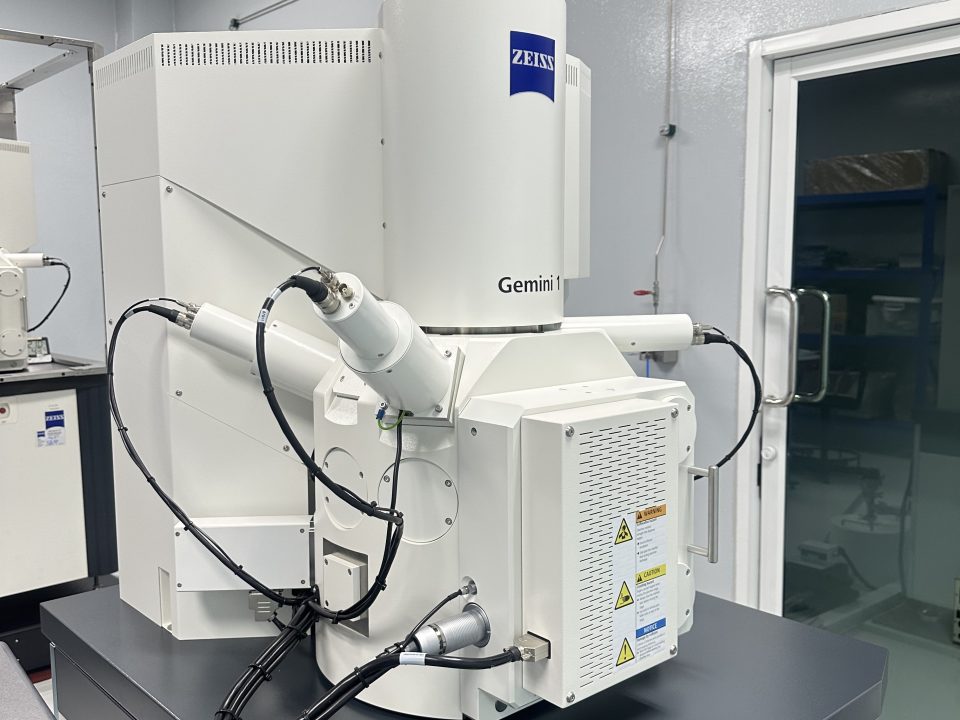
SEM-EDX: The Microscopic Eye That Reveals What Your Materials Are Really Made Of
In engineering, research, and industrial quality control, knowing exactly what your materials are made of isn’t just useful — it’s essential. That’s where SEM-EDX (Scanning Electron Microscopy with Energy Dispersive X-ray Spectroscopy) comes in. This internationally recognized technique gives scientists and engineers an unprecedented look at material composition at the microscopic level, making it one of the most powerful analytical tools available today.
What Exactly Is SEM-EDX?
SEM-EDX combines two complementary technologies into one powerful system:
SEM — Scanning Electron Microscope
Imagine being able to zoom into a material’s surface up to 500,000 times its actual size, with nanometer-level resolution. That’s what SEM does. Instead of light, it uses a focused beam of electrons to generate incredibly detailed images of a material’s surface and internal structure — all in compliance with ISO/TS 24597.
⚡ EDX — Energy Dispersive X-ray Spectroscopy
While SEM shows you what something looks like, EDX tells you what it’s made of. When the electron beam strikes a material, it triggers the emission of X-rays with energy levels unique to each element. By measuring these X-rays, EDX can identify which elements are present and in what quantities — down to a detection limit of approximately 0.1–1% by weight.
Together, these two technologies give you a complete picture: both the physical structure and the chemical composition of a material, simultaneously, in the same location.
How Does It Actually Work?
The science behind SEM-EDX is sophisticated, but the process follows a clear and logical sequence:
Step 1: Sample Preparation
Samples are prepared according to ASTM E1508 standards — typically involving surface polishing, solvent cleaning, and in some cases, coating with a conductive material like gold or carbon to prevent charge buildup on non-conductive samples.
Step 2: SEM Imaging
When the electron beam hits the sample surface, it produces two types of signals:
Secondary electrons → reveal surface topography
Backscattered electrons → highlight compositional contrast
These signals are captured and reconstructed into high-resolution images that show the material’s microstructure in remarkable detail.
Step 3: EDX Elemental Analysis
High-energy electrons knock inner-shell electrons out of atoms, creating vacancies. When outer-shell electrons drop down to fill these gaps, they release X-rays — and crucially, each element releases X-rays at a characteristic energy level. This is essentially the element’s fingerprint.
Step 4: Identification and Quantification
The EDX detector captures these X-ray signals and compares them against reference databases using algorithms based on ISO 22309 and ASTM E1508 standards to identify elements and calculate their relative concentrations.
Typical accuracy:
Major elements: ±1–2%
Trace elements: ±5–10%
Why SEM-EDX Stands Out
Feature
What It Means for You
Micro-level precision
Analyze composition in areas as small as a few micrometers — ideal for examining grain boundaries, inclusions, or localized defects
️ Non-destructive analysis
The core sample structure remains intact, allowing follow-up testing with other techniques
Integrated analysis
Physical and chemical data are captured together, making correlations faster and more reliable
⏱️ Fast turnaround
Preliminary results in minutes; full analysis within 1–2 hours
Versatility
Works on metals, polymers, ceramics, composites, and semiconductors
What Are the Limitations?
No tool is perfect. Here’s what to keep in mind when using SEM-EDX:
Light element detection — EDX struggles with elements lighter than sodium (atomic number < 11). Hydrogen, helium, and lithium cannot be detected at all.
Quantitative precision — While highly capable, SEM-EDX may be less precise than dedicated techniques like XRF or ICP-MS for strict quantitative work.
Sample preparation requirements — Samples must have clean, smooth surfaces, which can occasionally be time-consuming and may alter the sample slightly.
Cost — SEM-EDX instruments are expensive to purchase and maintain, and require trained specialists to operate — making per-analysis costs higher than simpler methods.
Real-World Applications Across Industries
Metals & Materials
Case study: SEM-EDX identified sulfide segregation at crack boundaries in a failed oil pipeline — directly pinpointing the root cause of the failure (Journal of Failure Analysis and Prevention, Vol. 18, 2018)
Alloy composition verification per ASTM E1508
Phase segregation and elemental distribution analysis
Coating interface contamination detection
Electronics
Case study: SEM-EDX revealed silicon contamination in gold bonding layers as the cause of MEMS sensor failure (IEEE Transactions on Device and Materials Reliability, Vol. 20, 2020)
PCB and component defect analysis
Solder joint quality inspection
Semiconductor material characterization per IEC 61249
Automotive & Aerospace
Failure analysis of structural components
Weld quality and dissimilar material joint inspection
Wear and corrosion analysis per SAE J1757
R&D and Advanced Materials
Nanostructure characterization
Particle distribution analysis in composite materials
Thin-film uniformity inspection for electronics and solar cells
How to Choose the Right SEM-EDX Service Provider
Getting accurate, actionable results depends not just on the equipment — but on the expertise behind it. When selecting a laboratory, look for:
✅ ISO/IEC 17025 accreditation — The international gold standard for testing and calibration laboratories
✅ Modern, well-maintained instruments — Precision analysis requires instruments that are regularly calibrated and updated
✅ Experienced scientists and engineers — Skilled interpretation of SEM-EDX data is as important as the data itself
✅ Comprehensive reporting — Reports should include SEM images, EDX spectra, quantitative analysis, and expert interpretation — not just raw numbers
Why ALS?
ALS Testing is an ISO/IEC 17025 accredited laboratory with over 40 years of experience in materials analysis. We serve research institutions, universities, and industrial clients across a wide range of sectors — delivering:
High-precision SEM-EDX analysis using state-of-the-art instruments
Expert consultation and technical guidance
Actionable insights to help you solve problems and improve product quality
Whether you’re investigating a product failure, developing a new material, or verifying a supplier’s specifications, ALS Testing gives you the analytical depth and scientific expertise to make confident, informed decisions.
The Bottom Line
SEM-EDX is one of the most powerful tools available for understanding what materials are made of and why they behave the way they do. By combining high-resolution imaging with precise elemental analysis in a single workflow, it delivers insights that are simply not possible with conventional testing methods.
Choosing an accredited, experienced laboratory partner ensures that those insights are accurate, reliable, and truly useful — whether for quality control, failure investigation, or cutting-edge research.
Contact ALS Testing Services (Thailand) Co., Ltd. today to learn how SEM-EDX analysis can help you build better products with greater confidence.
Read moreMay 6, 2026
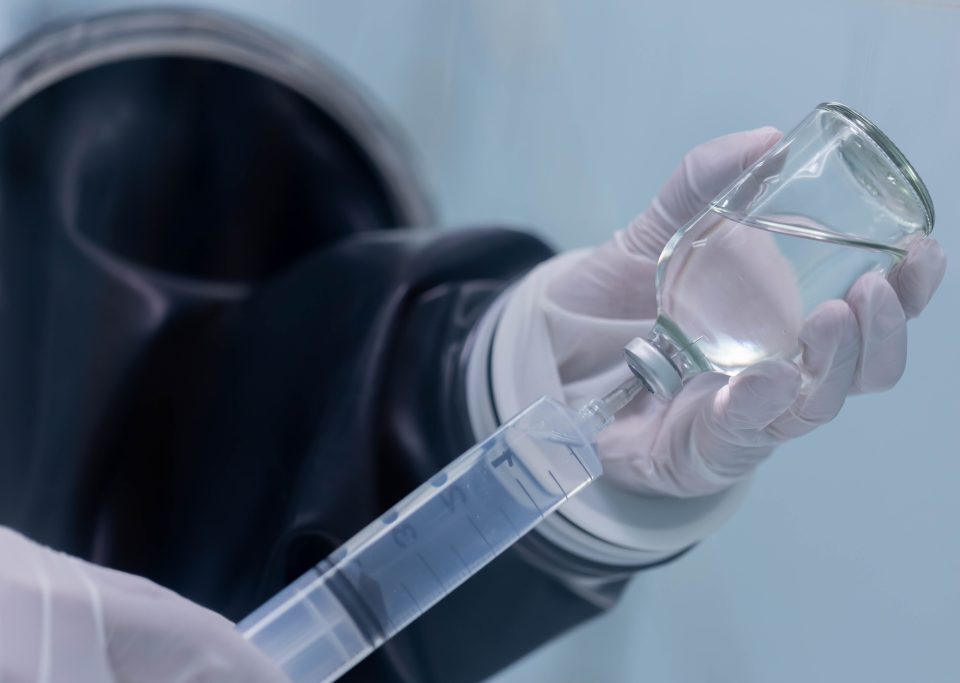
Why Chemical Testing Is the Foundation of Credible ESG Reporting
Numbers Only Matter If They Are Right
Every organization calculating its Carbon Footprint is working toward the same goal: an accurate, credible, and defensible picture of its greenhouse gas emissions. But here is the question most overlook —
How reliable is the data behind those numbers?
Carbon Footprint reporting, as defined by frameworks like the GHG Protocol and ISO 14064, is fundamentally a calculation. It takes Activity Data — fuel consumed, waste generated, refrigerants used — and multiplies it by established Emission Factors to estimate total greenhouse gas output.
The formula is standardized. The methodology is clear. But if the input data is inaccurate, even a perfectly executed calculation produces a misleading result.
This is exactly where chemical testing becomes essential.
What Is Chemical Testing — and What Does It Have to Do with Carbon?
Chemical testing is the process of collecting and analyzing samples from environmental media — air, water, soil, waste streams, and process gases — using standardized methods and equipment. The goal is to determine concentration, composition, and potential impact on the environment, human health, or regulatory compliance.
In the context of Carbon Footprint reporting, chemical testing is not about measuring carbon directly in a lab. Rather, it is about validating the quality of Activity Data — ensuring that what goes into the calculation actually reflects what is happening on the ground.
Carbon Footprint is the calculation. Chemical testing is what makes the inputs worth calculating.
Where Chemical Testing Makes a Real Difference
In complex industrial operations, relying on generic averages or assumptions introduces significant margin for error. Chemical analysis replaces those assumptions with real, site-specific data:
Table
Application
How It Improves Accuracy
Fuel Heating Value Analysis
Uses actual calorific value instead of generic averages
Stack Gas Measurement (CO₂, CH₄, N₂O)
Directly assesses combustion efficiency and emission rates
Wastewater COD Analysis
Calculates methane generation potential from treatment systems
❄️ Refrigerant Identification (HFCs, PFCs)
Ensures the correct Global Warming Potential (GWP) value is applied
Raw Material Composition Analysis
Supports accurate Scope 3 emission assessments
In each of these cases, chemical testing acts as a data verification layer — not replacing the Carbon Footprint calculation, but making the data that feeds it far more trustworthy.
Why Data Integrity Is Non-Negotiable
A Carbon Footprint report that earns stakeholder trust is not just mathematically correct — it is traceable, transparent, and verifiable. The factors that determine credibility go beyond the calculation itself:
✅ How Activity Data was collected and recorded
✅ Whether international standards are clearly referenced
✅ Internal quality control systems in place
✅ Transparency throughout the reporting process
Within the broader ESG framework — particularly on the environmental and governance dimensions — verifiable data is the bedrock of long-term credibility. Investors, regulators, customers, and partners are increasingly asking not just “What is your carbon footprint?” but “How do you know?”
More Than a Statistic — A Reflection of Who You Are
The figures in a Carbon Footprint report represent far more than emissions data. They are a statement of organizational accountability and transparency.
Choosing to ground your reporting in accurate, chemically verified data does two things at once:
Reduces the risk of reporting errors that could damage credibility or invite regulatory scrutiny
Builds a stronger foundation for long-term sustainability — one that holds up under audit, due diligence, and public disclosure
In an era where ESG performance is increasingly tied to business reputation and investment attractiveness, the quality of your data is the quality of your commitment.
The carbon numbers you report are only as strong as the data behind them. Make sure yours are built to last.
Learn more about ALS Testing’s Chemical Testing Services: https://www.alstesting.co.th/services/
Read more