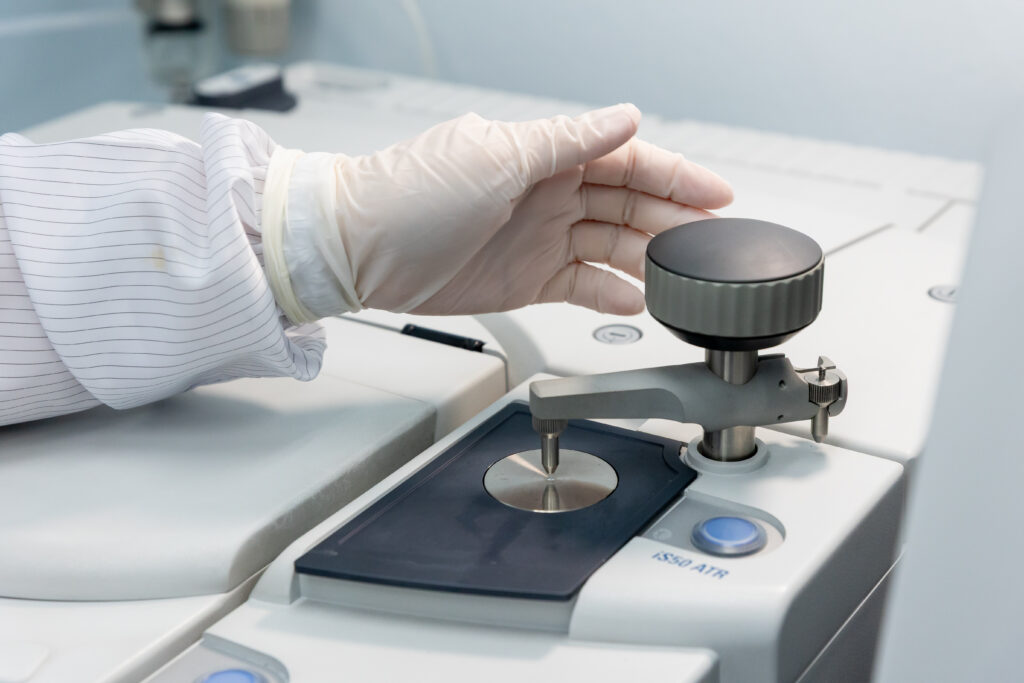
Failure Analysis Services
- โชว์สินค้าทั้งหมด
- No categories
May 6, 2026
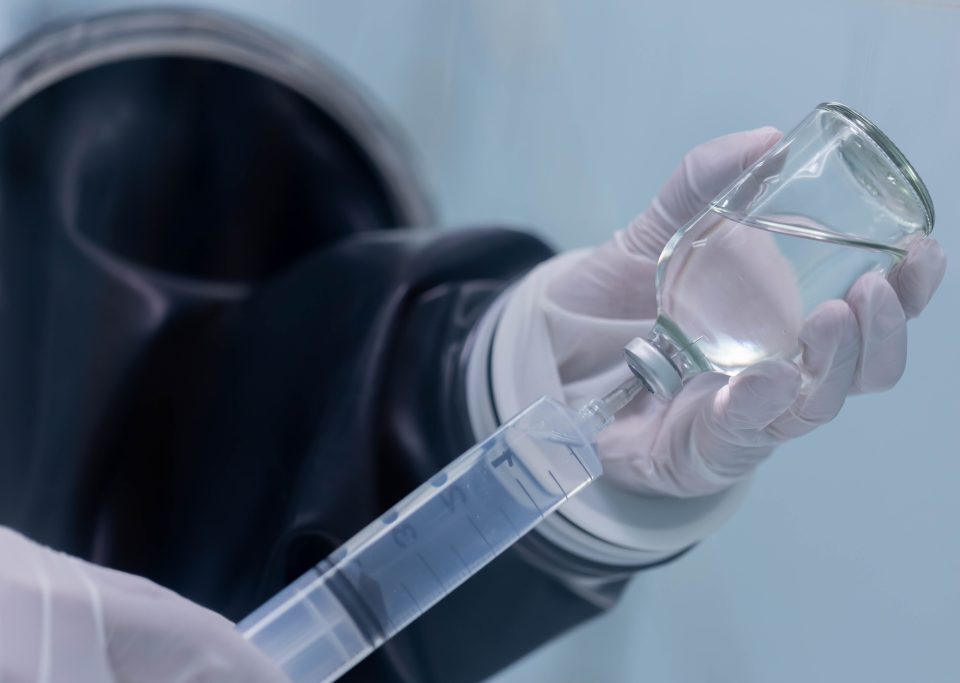
Why Chemical Testing Is the Foundation of Credible ESG Reporting
Numbers Only Matter If They Are Right
Every organization calculating its Carbon Footprint is working toward the same goal: an accurate, credible, and defensible picture of its greenhouse gas emissions. But here is the question most overlook —
How reliable is the data behind those numbers?
Carbon Footprint reporting, as defined by frameworks like the GHG Protocol and ISO 14064, is fundamentally a calculation. It takes Activity Data — fuel consumed, waste generated, refrigerants used — and multiplies it by established Emission Factors to estimate total greenhouse gas output.
The formula is standardized. The methodology is clear. But if the input data is inaccurate, even a perfectly executed calculation produces a misleading result.
This is exactly where chemical testing becomes essential.
What Is Chemical Testing — and What Does It Have to Do with Carbon?
Chemical testing is the process of collecting and analyzing samples from environmental media — air, water, soil, waste streams, and process gases — using standardized methods and equipment. The goal is to determine concentration, composition, and potential impact on the environment, human health, or regulatory compliance.
In the context of Carbon Footprint reporting, chemical testing is not about measuring carbon directly in a lab. Rather, it is about validating the quality of Activity Data — ensuring that what goes into the calculation actually reflects what is happening on the ground.
Carbon Footprint is the calculation. Chemical testing is what makes the inputs worth calculating.
Where Chemical Testing Makes a Real Difference
In complex industrial operations, relying on generic averages or assumptions introduces significant margin for error. Chemical analysis replaces those assumptions with real, site-specific data:
Table
Application
How It Improves Accuracy
Fuel Heating Value Analysis
Uses actual calorific value instead of generic averages
Stack Gas Measurement (CO₂, CH₄, N₂O)
Directly assesses combustion efficiency and emission rates
Wastewater COD Analysis
Calculates methane generation potential from treatment systems
❄️ Refrigerant Identification (HFCs, PFCs)
Ensures the correct Global Warming Potential (GWP) value is applied
Raw Material Composition Analysis
Supports accurate Scope 3 emission assessments
In each of these cases, chemical testing acts as a data verification layer — not replacing the Carbon Footprint calculation, but making the data that feeds it far more trustworthy.
Why Data Integrity Is Non-Negotiable
A Carbon Footprint report that earns stakeholder trust is not just mathematically correct — it is traceable, transparent, and verifiable. The factors that determine credibility go beyond the calculation itself:
✅ How Activity Data was collected and recorded
✅ Whether international standards are clearly referenced
✅ Internal quality control systems in place
✅ Transparency throughout the reporting process
Within the broader ESG framework — particularly on the environmental and governance dimensions — verifiable data is the bedrock of long-term credibility. Investors, regulators, customers, and partners are increasingly asking not just “What is your carbon footprint?” but “How do you know?”
More Than a Statistic — A Reflection of Who You Are
The figures in a Carbon Footprint report represent far more than emissions data. They are a statement of organizational accountability and transparency.
Choosing to ground your reporting in accurate, chemically verified data does two things at once:
Reduces the risk of reporting errors that could damage credibility or invite regulatory scrutiny
Builds a stronger foundation for long-term sustainability — one that holds up under audit, due diligence, and public disclosure
In an era where ESG performance is increasingly tied to business reputation and investment attractiveness, the quality of your data is the quality of your commitment.
The carbon numbers you report are only as strong as the data behind them. Make sure yours are built to last.
Learn more about ALS Testing’s Chemical Testing Services: https://www.alstesting.co.th/services/
Read moreMay 6, 2026
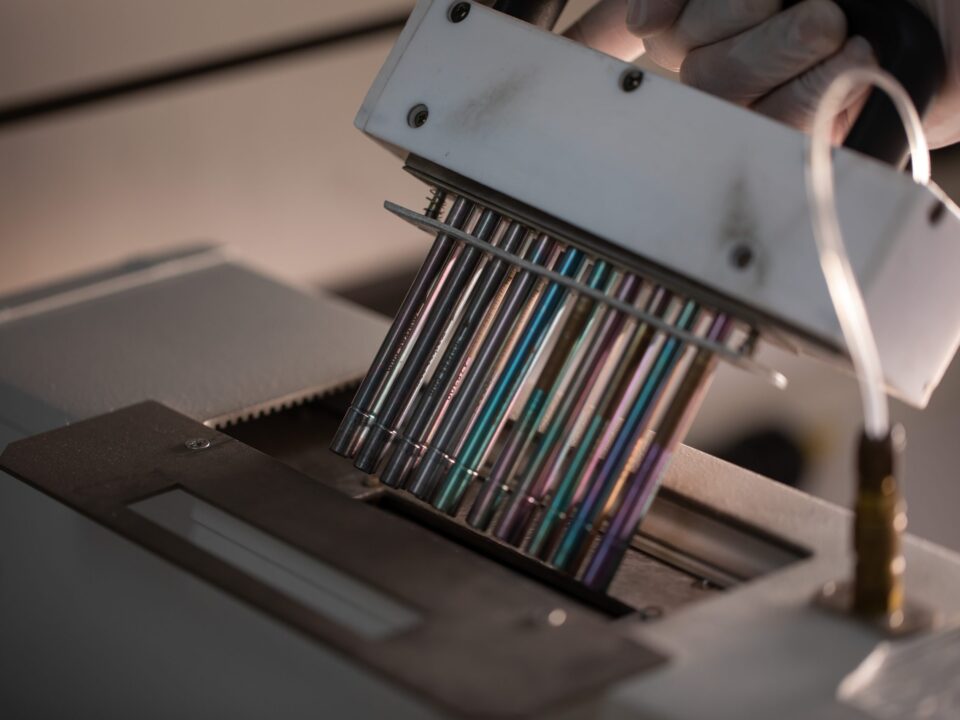
The Invisible Threat in Every Factory
Dust.
Fumes.
Chemical vapors.
They are present in nearly every manufacturing environment — and most of the time, you cannot see them.
As air pollution and industrial health concerns grow globally, workplace safety is no longer just a regulatory checkbox. Employees, business owners, and the public are paying closer attention to what workers breathe every day. Regulations are tightening. Standards are rising. And for good reason.
In many production processes, the real danger is not the accident you can see — it is the hazard you cannot.
Vapors released from solvents, paints, and adhesives
Fine dust and particles generated from grinding, cutting, or friction
Invisible residues and contaminants that accumulate on work surfaces over time
None of these cause immediate, dramatic symptoms. But prolonged exposure quietly damages the respiratory system, the nervous system, and overall health — often before anyone realizes there is a problem.
Factories that want to grow sustainably need tools that make these invisible risks visible. That is exactly what VOCs testing and FT-IR analysis are designed to do.
Two Tests, One Powerful Combination
VOCs Testing — What Is in the Air?
VOCs (Volatile Organic Compounds) testing measures the concentration of airborne organic chemicals in the workplace — production floors, enclosed processing areas, and anywhere chemical use is involved.
The results give factories clear, actionable intelligence:
Which areas carry the highest inhalation risk
When contamination levels spike above safe thresholds
Where to improve ventilation or adjust processes
Perhaps most importantly, having real numbers eliminates uncertainty. When employees ask “Is the air here safe?”, management can answer with data — not reassurances.
FT-IR Analysis — What Is That Dust?
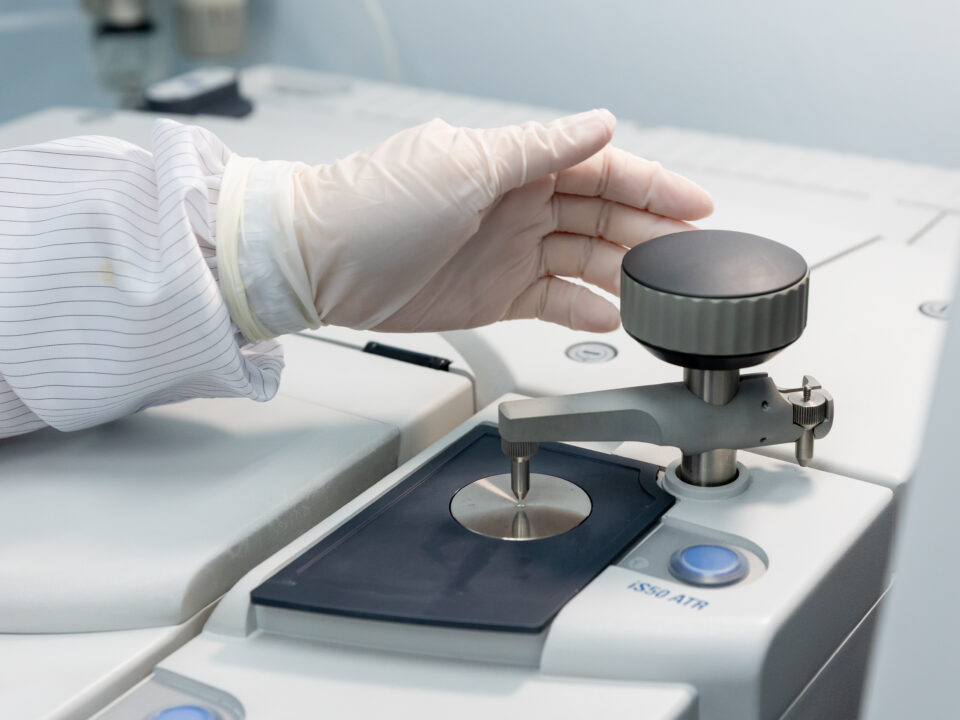
FT-IR (Fourier Transform Infrared Spectroscopy) takes a different but equally important angle. Rather than measuring air quality, it identifies the chemical identity of solid particles, residues, and contamination found in the workplace.
FT-IR works by analyzing how a material absorbs infrared light — producing a unique chemical “fingerprint” for each substance. Even from a tiny sample, or from dust invisible to the naked eye, FT-IR can accurately identify:
Plastics, rubber, and resins
Fibers and polymer materials
Chemical residues and unknown contaminants
Knowing exactly what the dust is allows factories to:
Pinpoint the true source of contamination
Adjust production processes or switch to safer materials
Reduce product defects and production waste
Better Together
VOCs and FT-IR are highly effective individually — but together, they provide a complete picture.
Table
VOCs Testing
FT-IR Analysis
Focus
Air quality
Particle & residue identity
Answers
What are workers breathing?
What is this dust or contaminant?
Key Benefit
Health risk assessment
Root cause identification
When used in combination, factories gain insight into both the air their people breathe and the materials their processes produce — enabling smarter, more targeted improvements across health, safety, and production quality.
Long-Term Benefits That Go Beyond Compliance
Better Production Quality
When you know exactly where contamination comes from, you can control it. Fewer defects. More consistent output. Greater confidence from customers and partners.
Lower Operating Costs
Solving problems with precise data eliminates costly guesswork — less rework, fewer unplanned line stoppages, and less wasted raw material.
A Workforce That Trusts You
When employees see that air quality and contamination are being actively monitored, they feel valued — not overlooked. That trust translates into stronger engagement, fewer grievances, and lower turnover over time.
Audit-Ready, Every Day
VOCs and FT-IR results serve as verifiable, scientific documentation of systematic risk management — whether facing regulatory inspections, occupational health audits, or assessments from business partners and clients.
From Invisible Risk to Informed Action — with ALS Testing
Creating a truly safe workplace is not a one-time exercise. It is an ongoing commitment built on reliable data.
By combining VOCs and FT-IR testing, factories can transform hidden risks into actionable insights — enabling precise adjustments to ventilation systems, material choices, and work procedures that protect both people and processes.
ALS Testing — a globally accredited laboratory operating in Thailand — brings world-class VOCs and FT-IR testing to your doorstep. No overseas sample submissions. No complicated logistics. Just internationally standardized results that give your factory the clarity it needs to keep improving.
Because workplace safety should not be a policy on paper. It should be part of how your business grows.
Read moreMay 6, 2026
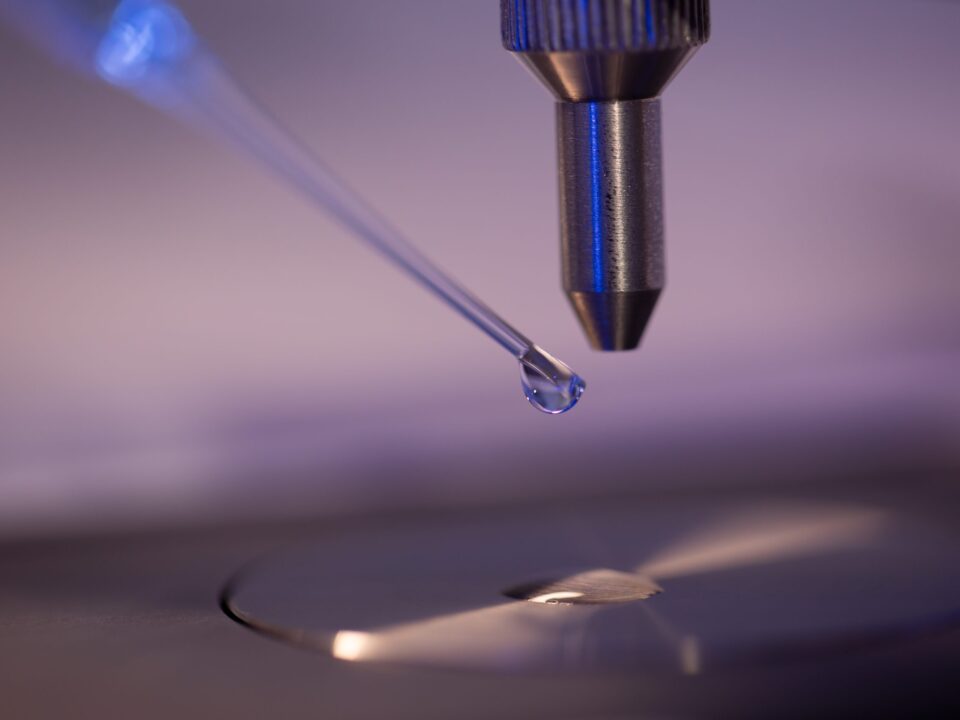
The Real Cost of Wrong Materials
In industrial and construction projects, quality failures rarely announce themselves immediately. By the time a problem surfaces — a coating that peels, a sealant that cracks, a polymer that fails under load — the damage is already done, and the cost to fix it is exponentially higher than it would have been to prevent it.
The most effective quality strategy is not inspection after the fact. It is verification at the source.
That is precisely where FT-IR (Fourier Transform Infrared Spectroscopy) plays a decisive role — as a powerful, science-backed first line of quality control.
What FT-IR Actually Does
FT-IR is an analytical technique that identifies the chemical structure of a material by measuring how it absorbs infrared light. Each material produces a unique spectral “fingerprint,” revealing:
What the material truly is — not just what it appears to be
What chemical groups it contains
Whether any chemical changes have occurred
It does not measure structural strength or load-bearing capacity. What it does — with speed and precision — is confirm that the material in your hands is exactly what it is supposed to be.
10 Ways FT-IR Strengthens First-Line QC
1. Confirm Material Identity Before Use
Is this epoxy, polyurethane, silicone, or something else entirely? FT-IR answers that question with certainty — preventing the wrong material from ever entering your process.
2. Filter Materials Before Expensive Testing
Mechanical and safety testing is time-consuming and costly. FT-IR acts as the first gate, ensuring only chemically verified materials move forward — saving both time and resources.
3. Track Quality Consistency Across Production Lots
The same product from different production batches is not always the same. FT-IR detects batch-to-batch variation, keeping quality consistent from project start to finish.
4. ⚠️ Detect Formula Changes or Unauthorized Substitutions
If a supplier changes raw materials, reduces key components, or delivers an off-spec formulation, FT-IR will reveal the chemical difference — clearly and objectively.
5. ️ Assess Material Condition, Not Just Type
FT-IR goes beyond identification. It can detect signs of thermal degradation, UV damage, or oxidation — providing early warning signals before a material fails in the field.
6. ️ Replace Guesswork with Science
Many materials look identical to the naked eye. FT-IR eliminates reliance on visual inspection or experience alone, replacing assumptions with hard analytical evidence.
7. Reduce the Long-Term Cost of Failure
Catching the wrong or degraded material at incoming inspection costs a fraction of what field failures, rework, or post-installation damage will demand. Prevention always pays.
8. Build a Traceable Quality Record
FT-IR results are documented, verifiable, and traceable — serving as reliable technical evidence in quality disputes and informed decision-making for engineers and management alike.
9. ⚡ Fast, Non-Destructive, and Non-Disruptive
Testing is rapid, requires minimal sample material, and does not interrupt production lines — making it perfectly suited for incoming inspection and routine spot checks.
10. A Smart First Step, Not the Final Word
FT-IR is a precision screening tool, not a replacement for structural or safety testing. By confirming chemical suitability first, it makes every subsequent test more targeted, more meaningful, and more cost-effective.
Where FT-IR Is Commonly Applied
FT-IR delivers strong results for any material with a defined chemical composition — particularly where materials look similar but perform very differently:
Table
Material Category
Why FT-IR Matters
Coatings & Anti-Corrosion Products
Verify formulation integrity before application
Construction Adhesives & Sealants
Confirm chemical type and detect substitution
Polymers, Rubber & Damping Components
Identify grade and detect degradation
Insulation, Foam & Plastics
Distinguish between visually similar materials
Know the Limits
FT-IR is a tool of precision — not a universal solution. It cannot replace structural load testing, crack detection, or engineering safety assessments. Those require dedicated mechanical and non-destructive testing methods. Used within its proper scope, however, FT-IR is one of the most efficient QC investments available.
Why ALS Testing
ALS Testing is an internationally accredited laboratory based in Thailand, delivering FT-IR analysis as part of a comprehensive, science-driven QC approach.
When materials enter the process already verified for chemical identity, condition, and conformance, the entire quality system performs better:
✅ Fewer surprises downstream
✅ More targeted advanced testing
✅ Stronger documentation for technical and commercial decisions
✅ Lower risk of costly late-stage failures
FT-IR with ALS Testing does not just check a box.
It changes the way organizations think about quality — from reactive to proactive, from assumption to evidence, from risk to confidence.
When first-line QC is right, everything that follows works better.
Read moreMay 6, 2026
ICE vs. EV: A New Kind of Risk
The shift from combustion engines (ICE) to electric vehicles (EV) changes more than the power source — it changes the entire risk profile.
ICE systems fail through mechanical wear — predictable, repairable.
EV systems fail through electrical faults and thermal instability — sudden, dangerous, and potentially irreversible.
Even a few microns of contamination can trigger a battery short circuit, leading to thermal runaway — and potentially fire or explosion.
Why ISO 16232 Now Matters for Safety
The updated VDA 19.1 (3rd Edition, 2025), developed by 40+ leading automotive companies, elevates ISO 16232 from a quality standard to a functional safety requirement, introducing:
Particle analysis below 50 microns
SEM/EDX inspection techniques
Standardized dry extraction methods
Failure assessment for battery and electronic components
How Contamination Causes EV Failures
In high-voltage EV systems (400–800V), small conductive particles can cause:
Short circuits
Electrical arcing
Insulation breakdown
Leakage currents
These failures occur without warning — making cleanliness a safety-critical design requirement, not just a quality checkpoint.
ICE vs. EV: Quick Comparison
Table
Factor
ICE
EV (High Voltage)
Main Risk
Mechanical wear
Short circuit / Thermal instability
Critical Particle Size
> 100 µm
< 50 µm
Primary Impact
Performance loss
Arcing, insulation failure
ISO 16232 Role
Quality standard
Functional safety standard
ISO 16232 in the EV Supply Chain
ISO 16232 is evolving from a measurement tool into a full process control framework:
Cleanliness limits tied to failure mechanisms
Integrated with PFMEA / DFMEA
Supported by real-time monitoring and traceability
The Road to Zero Contamination
To stay competitive, organizations should:
✅ Embed cleanliness into product design from day one ✅ Invest in SEM/EDX and real-time inspection tools ✅ Build data-driven process controls ✅ Train personnel and foster a quality-first culture
FAQ
Why are small particles more dangerous in EVs? High-voltage systems have lower insulation tolerance. Particles under 50 µm can instantly cause short circuits and trigger thermal runaway.
How does cleanliness relate to Functional Safety? Contamination can initiate electrical bridging and insulation failure — making it a direct concern under ISO 26262.
Where should organizations start? Define cleanliness requirements based on failure mechanisms, then integrate them into design, manufacturing, and inspection — supported by SEM/EDX and traceability systems.
What are the long-term benefits of compliance? Fewer recalls, reduced thermal and electrical failures, longer system lifespan, and stronger trust from OEM customers.
Read moreApril 24, 2026
Root Cause Investigation · Fracture Analysis · Corrosion Analysis · Material Identification · Cross-Section
ISO/IEC 17025 Accredited | SEM + FTIR + EDX + Cross-Section | Automotive Specialist
When a component fails in production, in qualification testing, or in the field, the questions that matter most are not simply ‘what failed’ but ‘why did it fail’ and ‘how do we ensure it does not fail again.’ Failure analysis is the disciplined forensic process that answers these questions, tracing a visible failure mode back to its physical, chemical, or process root cause.
In the automotive industry, failure analysis is a critical tool across the entire product lifecycle. During development, it identifies design or material weaknesses before they reach production. During qualification, it explains unexpected test failures and guides corrective action. During production, it investigates non-conformances and prevents recurrence. After field returns, it determines warranty liability, informs recall decisions, and drives product improvement.
ALS Testing provides specialist automotive failure analysis services using scanning electron microscopy (SEM), FTIR spectroscopy, energy-dispersive X-ray spectroscopy (EDX), optical microscopy, and metallurgical cross-section preparation. With scanning electron microscopy analysis reaching 260 searches per month in the Malaysian market – the highest search volume in our entire keyword set – this is both the most technically demanding and the most commercially significant capability in our laboratory portfolio.
What Is Failure Analysis?
Failure analysis is the systematic investigation of a component or material to determine the cause of an unexpected failure, non-conformance, or performance deficiency. It applies a structured sequence of analytical techniques, starting with non-destructive visual and optical examination, progressing to surface and interface analysis, and culminating in destructive cross-section and microstructural examination where required, to identify the physical, chemical, or mechanical mechanism responsible for the failure.
In automotive applications, failure analysis encompasses a wide range of failure modes and component types. Fracture analysis investigates cracked or broken metal, polymer, or composite components, determining whether the fracture originated from fatigue, overload, corrosion, embrittlement, or manufacturing defects. Corrosion analysis characterises the type and extent of corrosion damage and identifies contributing factors including material composition, coating quality, and environmental exposure. Delamination and adhesion failure analysis investigates separation at material interfaces including bonded joints, coatings, plated surfaces, and polymer-to-metal bonds. Contamination analysis identifies foreign particles or films on component surfaces or in lubrication systems that have caused or contributed to functional failure.
Failure Analysis in the Automotive Supply Chain
The automotive supply chain applies failure analysis at multiple points where the stakes of unresolved failures are highest. Tier-1 suppliers conduct failure analysis on components returned from OEM qualification testing, where a single test failure can delay programme launch. Warranty teams investigate field returns to distinguish design defects from manufacturing escapes, and to determine whether failures within the warranty period are attributable to the supplier, the assembly process, or the OEM’s application conditions. Purchasing and quality teams use failure analysis to assess whether returned components represent genuine supplier non-conformances or misuse and handling damage by the customer. In each case, the failure analysis report provides objective, evidence-based conclusions that carry weight in technical and commercial disputes.
Why Choose an Accredited Independent Laboratory for Failure Analysis?
Failure analysis conducted by an ISO/IEC 17025 accredited independent laboratory carries a level of credibility that in-house analysis cannot replicate. When failure analysis results are used in OEM disputes, insurance claims, product liability proceedings, or regulatory investigations, the independence and accreditation of the laboratory that produced the analysis is routinely scrutinised. ALS provides analysis that is conducted under a formal quality management system, with documented traceability of methods and equipment calibration, and with the objectivity of an organisation that has no stake in any particular outcome.
Our Failure Analysis Techniques
ALS failure analysis employs a suite of complementary analytical techniques, selected based on the nature of the failure, the material types involved, and the level of detail required to reach a defensible root cause conclusion. Our analysts are experienced in applying these techniques in combination; a fracture surface analysis, for example, may combine optical microscopy for initial characterisation, SEM for high-magnification morphological analysis, and EDX for elemental mapping of fracture features.
Scanning Electron Microscopy (SEM) Analysis
Scanning electron microscopy is the central analytical tool for failure analysis at the micro and nano scale. SEM images component surfaces, fracture faces, and cross-section features at magnifications from 20x to 100,000x, with a depth of field and resolution that far exceeds optical microscopy. SEM analysis reveals fracture morphology, the characteristic features that distinguish fatigue striations from intergranular fracture from ductile overload; identifies surface defects, pits, cracks, and corrosion morphology at the micrometre scale; characterises particle morphology in contamination investigations; and provides the imaging foundation for EDX elemental analysis.
All SEM analysis at ALS is conducted in a controlled environment to minimise contamination, with samples prepared using appropriate techniques for the material type, including gold or carbon sputter coating for non-conducting samples. SEM images are documented with scale bars, magnification, and operating conditions for full traceability in the final report.
Energy-Dispersive X-Ray Spectroscopy (EDX) Elemental Analysis
EDX is used in combination with SEM to provide elemental composition data from specific points, areas, or features on a sample surface. By detecting the characteristic X-rays emitted from a sample under electron beam excitation, EDX identifies which elements are present and at what relative concentrations. In failure analysis, EDX is applied to identify corrosion products (for example, distinguishing chloride-induced pitting from sulfate-driven corrosion), to characterise contaminating particles (distinguishing iron from aluminium from silicon-based particles), to verify coating composition, and to detect elemental segregation or depletion at fracture interfaces.
EDX mapping provides a spatial elemental distribution image across an area of interest, enabling visualisation of where specific elements are concentrated; for example, showing the distribution of zinc in a galvanic corrosion zone, or the localisation of chlorine at a corrosion initiation site.
FTIR Spectroscopy (Fourier Transform Infrared)
FTIR spectroscopy is the primary technique for identification of organic materials, polymers, coatings, and surface films in failure analysis. By measuring the infrared absorption spectrum of a material, FTIR produces a molecular fingerprint that can be matched against reference libraries to identify polymer types, adhesive formulations, lubricant residues, and contaminating films. FTIR is routinely applied in automotive failure analysis to identify: the composition of failed gaskets and seals; contaminating films on metal surfaces that inhibit adhesion or coating bonding; degraded or thermally oxidised polymer components; lubricant composition and degradation state; and foreign material contaminants found at failure sites.
ALS operates both standard FTIR for bulk material analysis and ATR (attenuated total reflectance) FTIR for surface film analysis, enabling characterisation of films as thin as a few micrometres without the need for destructive extraction.
Optical Microscopy & Stereo Microscopy
Optical microscopy at magnifications from 10x to 1000x provides the initial visual characterisation stage of failure analysis, identifying fracture locations, corrosion zones, delamination interfaces, and gross defects before higher-resolution SEM analysis is applied. Stereo microscopy at lower magnifications (7x to 50x) provides three-dimensional surface imaging of fracture faces and component surfaces with excellent depth of field, enabling documentation of large-area failure features in context. All optical microscopy images are captured digitally and documented with magnification and scale information.
Metallurgical Cross-Section Preparation & Analysis
Cross-section preparation involves embedding a component in resin, cutting through the area of interest, grinding and polishing to a metallographic finish, and optionally etching to reveal microstructural features, providing access to the internal structure of a component at the site of failure. Cross-section analysis reveals coating thickness and uniformity, interface integrity between layers, crack propagation paths and morphology, grain structure and phase distribution in metals, porosity and inclusion content in castings, and the presence of decarburisation, carburisation, or other surface treatments. Combined with SEM and EDX analysis of the prepared cross-section, this technique provides the most comprehensive internal characterisation of a failed component.
Failure Modes We Investigate
ALS failure analysis services address the full spectrum of failure modes encountered in automotive component manufacturing and service.
Fracture & Fatigue Failure Analysis
Fracture surfaces carry a detailed record of the failure mechanism, encoded in the morphological features of the fractured faces. Fatigue fractures display characteristic features including fatigue crack initiation sites, beach marks (progression marks showing crack growth over cycles), and fatigue striations at high magnification. Overload fractures show ductile features (dimples, shear lips) or brittle features (cleavage facets, intergranular separation) depending on material and loading conditions. ALS fractography, the systematic analysis of fracture surfaces, determines the failure mode, identifies the initiation site, and assesses whether the failure was consistent with design intent, an unexpected overload, or a material or manufacturing defect.
Corrosion & Surface Degradation Analysis
Corrosion failures in automotive components can take many forms: general uniform corrosion, pitting corrosion localised at surface defects or inclusions, galvanic corrosion at bimetallic interfaces, crevice corrosion in confined geometries, stress corrosion cracking in susceptible alloys under mechanical loading, and fretting corrosion at vibrating contacts. ALS corrosion analysis characterises the corrosion morphology by optical and SEM microscopy, identifies corrosion products by EDX elemental analysis and FTIR spectroscopy, and assesses the contribution of material composition, surface treatment quality, and environmental exposure to the observed damage.
Delamination & Adhesion Failure Analysis
Failures at material interfaces, including between coatings and substrates, bonded surfaces, plated layers and base materials, and moulded polymer overmoulds and metal inserts, are among the most common and commercially significant failures in automotive components. ALS investigates delamination failures by cross-section analysis to characterise the interface morphology, SEM and EDX analysis of both separated surfaces to determine the locus of failure (cohesive failure within a layer, or adhesive failure at the interface), and FTIR analysis to identify contaminating films or inadequate surface preparation that may have compromised adhesion.
Contamination & Foreign Material Analysis
Contaminating particles, films, or deposits on component surfaces can cause a range of functional failures from corrosion initiation to electrical resistance increase to mechanical interference. ALS contamination analysis applies the full suite of SEM, EDX, FTIR, and optical microscopy techniques to characterise contaminants and identify their source. This is frequently applied to investigation of corrosion-related warranty failures where a chloride, sulfate, or organic acid contaminant has initiated pitting or crevice corrosion, and to investigation of electrical contact failures where surface films have increased contact resistance.
Our Failure Analysis Process
ALS failure analysis follows a structured investigation process that ensures comprehensive characterisation and defensible conclusions in every case.
Stage
Activity
Output
1. Receipt & Review
Sample receipt, condition documentation, review of client background information
Sample condition record, investigation brief
2. Non-Destructive Examination
Visual, stereo, and optical microscopy – photographic documentation
Overview images, failure site characterisation
3. Surface Analysis
SEM imaging, EDX elemental analysis, FTIR surface film analysis
High-resolution images, elemental data, material identification
4. Destructive Examination
Cross-section preparation, metallographic analysis, SEM/EDX of cross-section
Internal structure characterisation, interface analysis
5. Data Synthesis
Integration of all analytical data, root cause determination, corrective action guidance
Draft failure analysis report
6. Reporting
Final report with images, data, conclusions, and recommendations
Formal failure analysis report – ISO/IEC 17025 accredited
Frequently Asked Questions – Failure Analysis
Q: What information should I provide when submitting a component for failure analysis?
The quality of a failure analysis investigation is directly related to the quality of the background information provided. When submitting a sample, please provide a description of the component and its function, the failure mode observed such as fracture, corrosion, or delamination, and details on when and how the failure was discovered in production, qualification, or the field. It is also helpful to include the operational history of the component if known, any relevant manufacturing information like material specification, heat treatment, surface treatment, and assembly history, and the specific outcome you require from the investigation. This could include root cause identification, technical evidence for specification compliance, or corrective action recommendations. The more context you provide, the more focused and relevant our investigation can be.
Q: How long does a failure analysis investigation take?
Turnaround time depends on the complexity of the investigation, the number of techniques required, and the current workload of our analytical team. A straightforward fracture analysis using SEM and EDX can typically be completed within five to ten business days. More complex investigations involving cross-section preparation, FTIR analysis, and comparative testing of multiple samples may require two to four weeks. For urgent investigations, particularly production-critical failures, please contact our team directly to discuss expedited options.
Q: Can failure analysis results be used in legal or commercial disputes?
Yes. Failure analysis reports produced by ISO/IEC 17025 accredited laboratories are routinely used as technical evidence in commercial disputes, insurance claims, product liability proceedings, and regulatory investigations. The accreditation of ALS Testing means that our reports are produced under a formally audited quality management system, with documented traceability of methods, equipment, and analyst qualifications. If your investigation has a legal or commercial dimension, please advise our team at the outset so that we can ensure the investigation is conducted and documented to the appropriate standard.
Q: What is SEM analysis and why is it important for failure analysis?
Scanning electron microscopy (SEM) is a technique that uses a focused electron beam to image surfaces at very high magnification and resolution. Unlike optical microscopy, SEM can achieve magnifications of 100,000x or higher with a depth of field that makes it ideal for imaging rough fracture surfaces, corroded surfaces, and three-dimensional microstructural features. SEM is important for failure analysis because it reveals the micro-scale morphological evidence that distinguishes one failure mechanism from another: fatigue striations, cleavage facets, corrosion pits, and particle morphology are all characteristic features that guide the analyst’s conclusion about root cause.
Q: Can ALS analyse plastic, rubber, and composite material failures as well as metals?
Yes. ALS failure analysis services cover metals, polymers, rubbers, composites, adhesives, coatings, and electronics materials. FTIR spectroscopy is our primary tool for polymer and organic material characterisation, enabling identification of polymer type, degradation state, and contaminating species. SEM and EDX analysis are applied to polymer fracture surfaces, interface failures, and contaminant identification in non-metallic components. Our analysts have experience with the full range of materials used in automotive manufacturing.
Request a Failure Analysis Investigation
When a component failure requires expert investigation, ALS Testing provides the analytical depth, accredited methodology, and clear reporting that automotive manufacturers require. Contact our team today to discuss your failure analysis requirements and receive guidance on sample submission.
→ Request a Quote: https://www.alstesting.co.th/request-a-quote/
→ Back to Automotive Testing Hub: /automotive-testing/
ISO/IEC 17025 Accredited | SEM + FTIR + EDX + Cross-Section | Fast Turnaround Available
Read more