VDA19
- โชว์สินค้าทั้งหมด
- No categories
June 2, 2026
At some point in the component qualification process, your OEM or customer will specify a cleanliness requirement. That requirement will reference one of two standards: ISO 16232 or VDA 19. If you have not worked with technical cleanliness testing before, the distinction between them is not immediately obvious. Both cover the same subject. Both are widely used in automotive manufacturing. And in practice, they are more aligned than their different names suggest.
But the differences matter, and choosing the wrong standard for your submission can delay qualification or require retesting. This guide explains what each standard covers, how they relate to each other, and how to determine which one your specific application requires.
Where ISO 16232 and VDA 19 Come From
ISO 16232 is the international standard for technical cleanliness testing in road vehicles. It was developed by ISO Technical Committee 22, the body responsible for road vehicle standards, and is published in ten parts covering the full range of cleanliness test activities – from sampling strategy and extraction methods through to analysis and reporting. Because it is an ISO standard, it is adopted as the reference framework by most international OEMs and by testing laboratories operating outside Germany.
VDA 19 is the equivalent German automotive industry standard, published by the VDA – the Verband der Automobilindustrie, the German Association of the Automotive Industry. It was developed by and for the German automotive industry, and reflects the cleanliness testing practices established by German OEMs over decades of precision component manufacturing. VDA 19 is published in two parts: Part 1 covers particle contamination analysis of functionally relevant automotive components, and Part 2 covers assembly environment requirements for technical cleanliness.
The relationship between them is a deliberate harmonisation. VDA 19 Part 1 and ISO 16232 were aligned through a coordinated revision process, with the result that the two standards are technically equivalent for most cleanliness testing applications. The methods, particle extraction principles, classification logic, and analytical requirements are substantively the same. Where they differ is in specific reporting format details, particle classification notation, and the scope of Part 2 of VDA 19, which has no direct ISO equivalent covering assembly environment requirements.
ISO 16232 and VDA 19 are harmonised standards covering the same testing discipline. Choosing between them is primarily a matter of which your OEM or customer specifies – not a choice between different test methods.
What ISO 16232 and VDA 19 Cover
ISO 16232 Structure and Scope
ISO 16232 is organised as a single consolidated document covering all aspects of cleanliness testing. The key sections for most testing applications are:
Part 5: Cleanliness inspection principles, covering inspection method selection, start parameters, cleaning mechanism parameters, and staff competency requirements.
Part 6: Qualification testing and blank level determination, including routine inspection and double inspection protocols.
Part 7: Extraction methods, covering preparatory and post-treatment steps, liquid extraction, and air extraction approaches.
Part 8: Analysis filtration, defining the filtration method used to prepare extracted particles for examination.
Part 9: Analysis methods, including Standard analysis, Extended analysis, and Shortened analysis, each suited to different testing scenarios.
The full ISO 16232 framework provides a complete methodology from extraction through to reporting, applicable to any automotive component where cleanliness is a functional requirement.
VDA 19 Structure and Scope
VDA 19 Part 1 covers functionally equivalent ground to ISO 16232, with the same core methodology: extraction of particles from the component, gravimetric and light obscuration particle counting, microscopic classification, and cleanliness class assignment. The particle size ranges, classification categories, and reporting principles are aligned with ISO 16232.
VDA 19 Part 2 is distinct. It addresses the assembly environment – the cleanliness requirements for the cleanroom or controlled environment in which precision components are assembled. It defines cleanliness classes for workspaces, tools, personnel, and packaging, providing a framework for controlling contamination introduction during the assembly process. ISO 16232 does not have an equivalent part covering assembly environments, which is why VDA 19 Part 2 remains in active use even among organisations whose component testing follows ISO 16232.
Key Similarities and Differences
For most cleanliness testing applications, the practical similarities between the two standards are more significant than their differences. The table below summarises the key dimensions.
Dimension
ISO 16232
VDA 19
Origin
International (ISO TC 22)
German automotive industry (VDA)
Technical equivalence
Harmonised with VDA 19 Part 1
Harmonised with ISO 16232
Particle extraction methods
Liquid: Pressure rinsing, Ultrasonic, Agitation, Internal rinsing.
Air: Air jet, Air through flow
Liquid: Pressure rinsing, Ultrasonic, Agitation, Internal rinsing.
Dry: Air jet, Air through flow, Stamping, Suction
Gravimetric analysis
Standard analysis
Standard analysis
Light Obscuration Particle Counting (LPC)
Shorten analysis
Shorten analysis
Microscopic particle classification
Standard analysis
Standard analysis
Particle size ranges
Particle size > 50 µm
Particle size > 50 µm
Particle classification types
Metallic, non metallic, fibre
Same categories
Cleanliness class notation
ISO cleanliness class format
VDA cleanliness class format – slightly different notation
Assembly environment
Not covered
Covered in VDA 19 Part 2
Report format
ISO 16232 format
VDA 19 format, different layout conventions
Primary adopters
Global OEMs, non-German automotive markets
German OEMs and their Tier-1 supply chains
The notation difference in cleanliness class reporting is worth noting. Both standards define cleanliness classes based on particle counts per size range, but the way those classes are expressed in the test report differs between the two standards. If your OEM has specified a cleanliness requirement using VDA 19 notation, submitting a report in ISO 16232 format and vice versa can create confusion in the review process, even if the underlying analytical data is identical.
Which Standard Applies to Your Situation?
The straightforward answer: the standard that applies to your situation is the one your OEM or customer has specified. If the specification document, the purchase order, or the supplier quality requirement references VDA 19 – test to VDA 19 and report accordingly. If it references ISO 16232 – test to ISO 16232. Where the customer has specified both, which does happen in supply chains that cross between German and non-German OEM requirements, your laboratory will need to produce a report that addresses both frameworks.
Where no specific standard is referenced, or where you are establishing a cleanliness specification for a new product rather than responding to an OEM requirement, the choice is more open. The following considerations are relevant.
Choose ISO 16232 If…
Your primary customers or OEM relationships are outside Germany – particularly Japanese, American, Korean, or UK-based OEMs
You are testing to support ISO-referencing type approvals or international regulatory submissions
Your laboratory scope or accreditation references ISO 16232 as the test method
You are developing a cleanliness specification for a new component and want maximum international portability
Choose VDA 19 If…
Your customer is a German OEM or a Tier-1 supplier directly serving BMW, Volkswagen Group, Mercedes-Benz, Audi, Bosch, or ZF
The supplier quality manual, PPAP requirements, or component specification explicitly references VDA 19
You are testing for assembly environment qualification as well as component cleanliness – VDA 19 Part 2 is the relevant standard for this
Your existing cleanliness classification system uses VDA 19 notation and you need continuity across historical data sets
When Both Apply
Some Tier-1 suppliers serve multiple OEM relationships that span German and non-German customers. In this case, the same component may need to meet cleanliness requirements under both frameworks. Because the test methods are harmonised, a single test programme can produce data that satisfies both standards, provided the laboratory issues reports in the appropriate format for each customer requirement. Confirm this capability with your laboratory before proceeding, and provide both specification references when submitting your samples.
Because ISO 16232 and VDA 19 are technically harmonised, a single set of test results can satisfy both standards. The difference lies in how the report is formatted and how the cleanliness class is expressed.
A Note on Accreditation
Regardless of which standard your cleanliness test is conducted to, the laboratory producing the results should be accredited to ISO/IEC 17025:2017. This accreditation is the foundation of credibility for your test data. It means that the methods, equipment, and quality system behind your results have been independently audited and verified.
In practice, OEMs and procurement teams reviewing cleanliness test reports will look for the accreditation mark before they assess the results. A non-accredited report, however technically competent the laboratory, is not accepted as formal compliance evidence for OEM qualification, type approval, or regulatory submission purposes.
ALS Testing is accredited to ISO/IEC 17025:2017. Our cleanliness testing capability covers both ISO 16232 and VDA 19, with reports formatted to the appropriate standard for each customer requirement. Our results are accepted by OEMs in more than 100 countries.
Practical Checklist Before You Submit Samples for Cleanliness Testing
Having the right information ready before sample submission helps your laboratory select the correct methods, format the report correctly, and avoid unnecessary follow-up. The following checklist covers the key points.
Confirm the standard: identify whether the OEM or customer specification references ISO 16232, VDA 19, or both
Confirm the cleanliness class requirement: obtain the specified cleanliness class or particle count limits from the specification document
Confirm the component type and critical surfaces: identify which surfaces and channels need to be sampled
Confirm the extraction method: some specifications define the required extraction method; if not, your laboratory will advise based on component geometry
Confirm whether SEM-EDX particle identification is required: some OEM specifications require elemental identification of particles above a defined size. If required, confirm this capability with your laboratory at the enquiry stage.
Confirm report format requirements: if your OEM requires a specific report format or data template, provide this to your laboratory before testing begins
Package samples correctly: seal components in clean polythene bags immediately after manufacture to prevent post-manufacture contamination that would invalidate the test
Summary
ISO 16232 and VDA 19 are technically harmonised standards covering the same testing discipline: the extraction, quantification, and classification of particulate contamination from precision automotive components. The choice between them is driven primarily by your OEM requirement, not by any fundamental difference in the testing process.
German OEMs and their direct Tier-1 suppliers will typically specify VDA 19. Global OEMs outside Germany will typically specify ISO 16232. Where both apply, the harmonised methods allow a single test programme to satisfy both frameworks with appropriate dual reporting.
What matters most in both cases is that the testing is conducted by an ISO/IEC 17025 accredited laboratory with genuine specialist capability in technical cleanliness testing – the extraction methods, particle counting equipment, microscopic analysis, and reporting experience to produce results that your OEM will accept without qualification.
Next Steps
See our full Cleanliness and Particle Testing capability: https://www.alstesting.co.th/technical-cleanliness-testing/
Read our detailed guide to VDA 19 testing requirements: /blog/vda-19-guide/
Download our ISO 16232 test preparation checklist: /blog/iso-16232-checklist/
Contact our team to discuss your cleanliness testing requirements: https://www.alstesting.co.th/contact-us/
Read moreMay 7, 2026

In industries like automotive, electronics, and medical devices, cleanliness is not optional — it’s a fundamental requirement. Even microscopic dust particles can compromise product quality, trigger costly recalls, and damage your brand’s reputation. That’s why Dust Analysis (Particle Analysis) is a critical step that gives manufacturers the confidence their products meet both domestic and international standards.
ALS Testing Services (Thailand), a member of the ALS Global network with over 40 years of testing and quality inspection expertise, offers comprehensive, internationally accredited dust analysis services — helping businesses elevate product quality and reduce production risk.
What Is Dust Analysis?
Dust Analysis is the process of detecting, measuring, and classifying particulate contaminants found in components, finished products, or production environments. Using specialized tools and standards, it evaluates whether contamination levels affect:
✅ Product quality and performance
✅ Safety requirements
✅ International standards such as VDA 19 (Technical Cleanliness of Components) and ISO 16232:2018 (Cleanliness of Components in Automotive Manufacturing)
ALS Testing’s 3-Step Dust Analysis Service
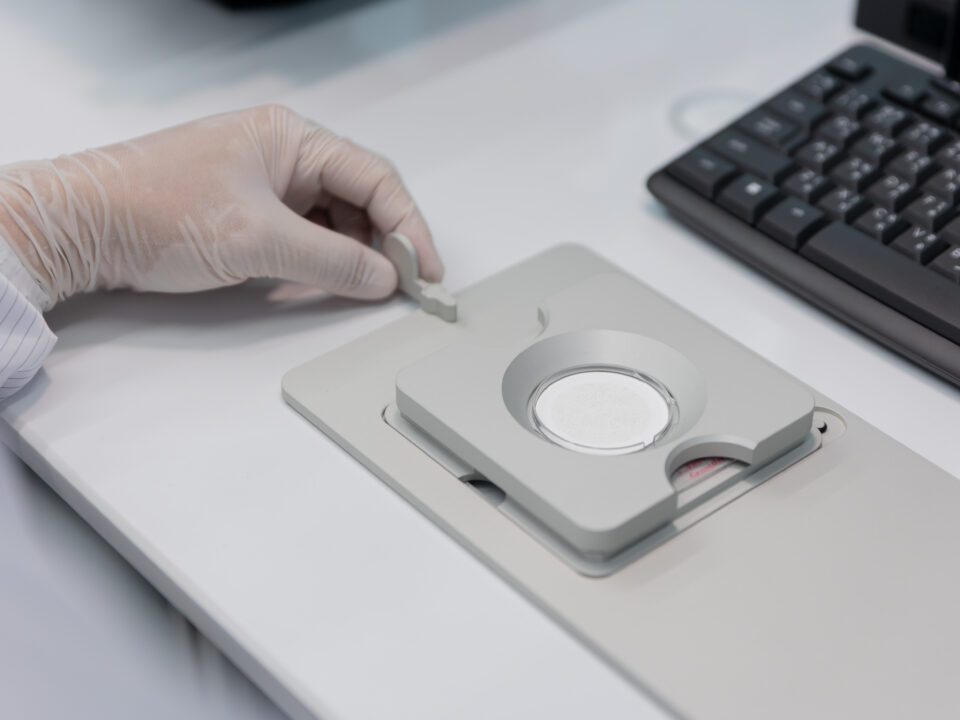
Step 1: Validation of Extraction Parameters
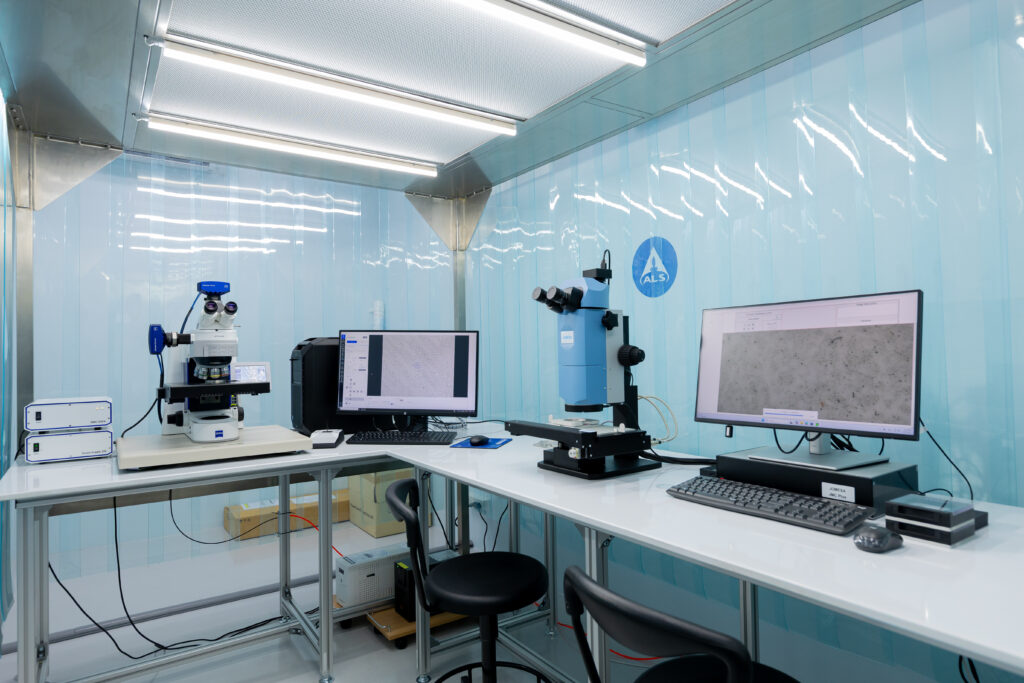
Before analysis begins, we verify that the particle extraction method is appropriate for your specific component. This involves 6 repeated extractions, analyzed through a Particle Analyzer — ensuring accuracy and full compliance with VDA 19 / ISO 16232 criteria.
Step 2: Particle Analysis
Once extraction is validated, the extracted particles are classified into three main categories:
Table
Category
Examples
Metallic
Iron, aluminum, and copper shavings from wear and machining
Non-Metallic
Plastic, rubber, or environmental dust particles
Fiber
Threads from fabric, filters, or packaging materials
Results specify the quantity, size, and type of each particle — enabling manufacturers to assess whether their components meet cleanliness standards and to plan precise maintenance actions.
Step 3: Advanced Analysis
When deeper identification is needed, ALS Testing offers cutting-edge analytical technologies:
SEM/EDX (Scanning Electron Microscopy with Energy-Dispersive X-ray Analysis) — identifies the elemental composition of metallic particles
FTIR (Fourier Transform Infrared Spectroscopy) — identifies non-metallic particles such as plastics, rubber, and natural fibers
4 Business Benefits of Dust Analysis
1. ️ Reduce the Risk of Product Recalls
By detecting contamination before products reach customers, dust analysis helps you catch problems at the source — preventing costly recalls, economic losses, and damage to customer trust.
2. Compete Confidently in Global Markets
International markets — especially automotive, electronics, and medical — enforce strict cleanliness requirements. Standards-compliant dust analysis confirms your products are ready for these markets, opening doors to new trade opportunities.
3. ⚙️ Improve Production Process Efficiency
Particle data reveals contamination rates and their origins — whether from machinery, the work environment, or assembly steps. This actionable intelligence allows manufacturers to eliminate risk points and optimize production for the long term.
4. Build Customer and Partner Confidence
Test results from an ISO/IEC 17025-accredited laboratory provide tangible proof of quality — giving customers and business partners the assurance that your products undergo rigorous quality control. This is a powerful foundation for building lasting business relationships.
Which Industries Benefit from Dust Analysis?
Dust analysis isn’t limited to automotive alone. Here’s how it adds value across multiple sectors:
Food & Beverage
Dust and particles from packaging, machinery, or the environment can contaminate food products and cause failures under safety standards like HACCP, GMP, or ISO 22000. ALS particle analysis pinpoints contaminant types and sources — enabling targeted fixes such as improved packaging steps or upgraded air filtration systems.
Cosmetics & Personal Care
In skincare and cosmetics production, tiny particles — dust, fibers, or material fragments — can cause skin irritation, adverse reactions, or product degradation. Dust analysis helps manufacturers identify and eliminate contamination before products reach consumers.
⛽ Energy & Petrochemical
Dust particles, metal debris, and sediment deposits can cause blockages, accelerated wear, and equipment damage that disrupts operations. Regular particle analysis keeps pipes, hydraulic systems, and process equipment clean — maintaining both safety and operational efficiency.
Elevate Your Quality Standards with ALS Testing Services
In today’s highly competitive industrial landscape, cleanliness standards are not a box to check — they are a strategic quality tool. Neglecting dust analysis risks product defects, regulatory non-compliance, and reputational damage that is far more costly than the test itself.
ALS Testing Services (Thailand) is your trusted partner — backed by 40+ years of ALS Global expertise, world-class analytical standards, advanced technology, and clear, actionable reports designed to help you improve, compete, and grow.
Achieve world-class cleanliness confidence — with ALS Testing Services.
Read moreMay 7, 2026
In the automotive industry, precision is everything. Countless components operate within hydraulic systems, oil circuits, and delicate mechanisms where even the tiniest foreign particle can cause serious problems. Yet one quality factor that manufacturers often overlook — despite its significant impact — is particle cleanliness.
Microscopic metal shavings, plastic fragments, or tiny fibers invisible to the naked eye can silently compromise the performance and lifespan of critical components. That’s why particle analysis is no longer just an inspection task — it’s a core pillar of any robust quality management system.
The Standards Behind the Science: VDA 19 & ISO 16232
Two internationally recognized standards govern particle cleanliness testing in the automotive world:
Table
Standard
Role
VDA 19
Provides procedural guidelines and test methods
ISO 16232
Establishes universal criteria for communication between OEMs and suppliers
Using both standards together ensures that particle analysis results are globally comparable, traceable, and credible — making it easier for factories to benchmark quality and meet OEM expectations.
Why Does It Matter?
Even particles just a few microns in size can trigger unexpected failures, such as:
Blocked oil channels in hydraulic systems
Increased friction and wear in precision moving parts
Stiffening of mechanical components, reducing responsiveness
False signals in electronic systems, causing malfunctions
Think of particle analysis as a preventive health check for your production line — identifying contamination risks before they turn into real-world failures.
How Particle Analysis Works: A 2-Step Process
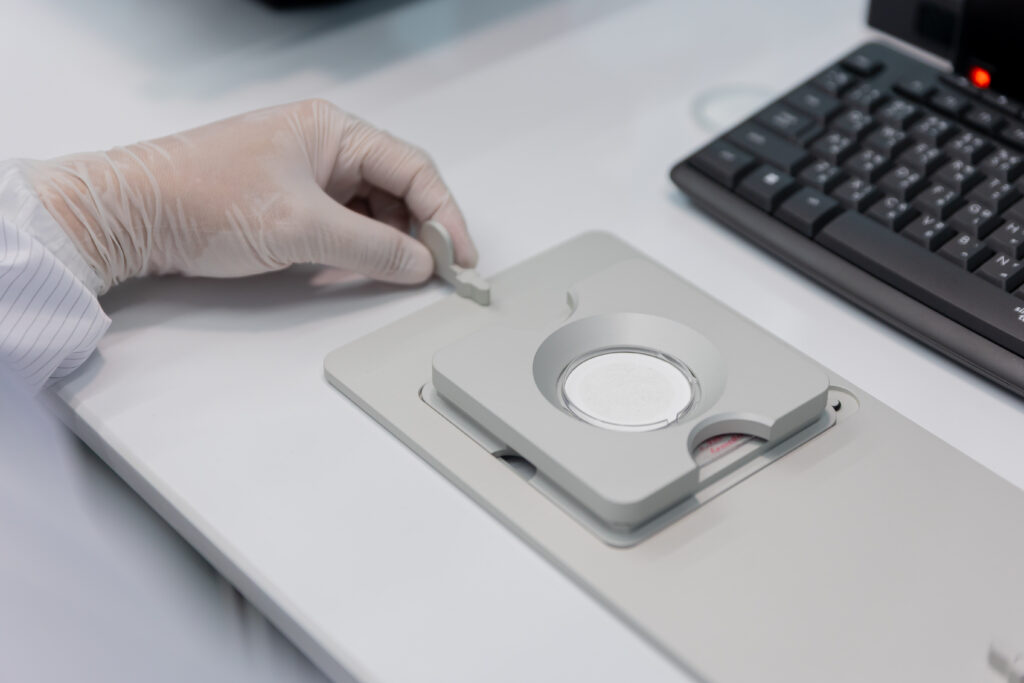
Step 1: Decline Test — Validating Extraction Parameters
The first step under VDA 19 is the Decline Test, which verifies that the particle extraction method is appropriate for the specific component being tested. This confirms that all potentially contaminating particles are consistently extracted — with no variability caused by equipment or methodology.
⚠️ If the Decline Test fails, it signals instability in the production or cleaning process — which must be corrected before proceeding to the main analysis.
Step 2: Particle Analysis — Classification and Quantification
Once extraction is validated, particles are categorized into three groups:
Metallic — metal shavings or fragments from machining
Non-Metallic — plastic, rubber, or other solid particles
Fiber — thread-like contaminants from packaging or assembly
This classification tells manufacturers not just how many particles are present, but what type, what size, and — critically — where they came from: machining, assembly, surface finishing, or even component packaging.
4 Real Business Benefits of World-Class Particle Testing
1. ⬇️ Reduce Scrap and Production Costs
Once the source of contamination is pinpointed, targeted corrective actions — such as improving washing steps or adding dust protection — lead directly to lower scrap rates and more stable production output.
2. Boost Supplier Credibility with OEMs
Reporting to ISO 16232 means your results speak a universal language that OEMs understand and trust — eliminating interpretation gaps and positioning your factory as a reliable, quality-controlled supplier.
3. Enable Continuous Process Monitoring
Particle data allows factories to track cleanliness trends over time, enabling proactive maintenance planning and preventing quality issues from ever reaching the customer.
4. Build the Foundation for Zero Defect Manufacturing
By controlling quality at the particle level, factories can detect defects that are completely invisible to the human eye — moving steadily closer to the Zero Defect goal through data-driven, precisely targeted improvements.
Comprehensive Particle Cleanliness Testing with ALS Testing
For manufacturers committed to systematic cleanliness improvement, conducting particle analysis under VDA 19 and ISO 16232 within an ISO/IEC 17025-accredited laboratory is an essential step — one that reduces quality risk and aligns your processes with the expectations of global automotive manufacturers.
ALS Testing delivers a complete end-to-end service covering every stage:
✅ Custom extraction condition design for each component type ✅ Filtration, particle counting, and classification ✅ Categorization per VDA 19 / ISO 16232 criteria ✅ Detailed reports ready for direct OEM submission
The results can be immediately applied to improve production processes, plan waste reduction, and establish internal cleanliness standards aligned with your business goals.
Whether you’re looking to stabilize production, reduce scrap, strengthen OEM alignment, or lay the groundwork for Zero Defect Manufacturing — particle cleanliness analysis with ALS Testing is the confident first step toward getting there.
Read moreMay 6, 2026

Why Chemical Testing Is the Foundation of Credible ESG Reporting
Numbers Only Matter If They Are Right
Every organization calculating its Carbon Footprint is working toward the same goal: an accurate, credible, and defensible picture of its greenhouse gas emissions. But here is the question most overlook —
How reliable is the data behind those numbers?
Carbon Footprint reporting, as defined by frameworks like the GHG Protocol and ISO 14064, is fundamentally a calculation. It takes Activity Data — fuel consumed, waste generated, refrigerants used — and multiplies it by established Emission Factors to estimate total greenhouse gas output.
The formula is standardized. The methodology is clear. But if the input data is inaccurate, even a perfectly executed calculation produces a misleading result.
This is exactly where chemical testing becomes essential.
What Is Chemical Testing — and What Does It Have to Do with Carbon?
Chemical testing is the process of collecting and analyzing samples from environmental media — air, water, soil, waste streams, and process gases — using standardized methods and equipment. The goal is to determine concentration, composition, and potential impact on the environment, human health, or regulatory compliance.
In the context of Carbon Footprint reporting, chemical testing is not about measuring carbon directly in a lab. Rather, it is about validating the quality of Activity Data — ensuring that what goes into the calculation actually reflects what is happening on the ground.
Carbon Footprint is the calculation. Chemical testing is what makes the inputs worth calculating.
Where Chemical Testing Makes a Real Difference
In complex industrial operations, relying on generic averages or assumptions introduces significant margin for error. Chemical analysis replaces those assumptions with real, site-specific data:
Table
Application
How It Improves Accuracy
Fuel Heating Value Analysis
Uses actual calorific value instead of generic averages
Stack Gas Measurement (CO₂, CH₄, N₂O)
Directly assesses combustion efficiency and emission rates
Wastewater COD Analysis
Calculates methane generation potential from treatment systems
❄️ Refrigerant Identification (HFCs, PFCs)
Ensures the correct Global Warming Potential (GWP) value is applied
Raw Material Composition Analysis
Supports accurate Scope 3 emission assessments
In each of these cases, chemical testing acts as a data verification layer — not replacing the Carbon Footprint calculation, but making the data that feeds it far more trustworthy.
Why Data Integrity Is Non-Negotiable
A Carbon Footprint report that earns stakeholder trust is not just mathematically correct — it is traceable, transparent, and verifiable. The factors that determine credibility go beyond the calculation itself:
✅ How Activity Data was collected and recorded
✅ Whether international standards are clearly referenced
✅ Internal quality control systems in place
✅ Transparency throughout the reporting process
Within the broader ESG framework — particularly on the environmental and governance dimensions — verifiable data is the bedrock of long-term credibility. Investors, regulators, customers, and partners are increasingly asking not just “What is your carbon footprint?” but “How do you know?”
More Than a Statistic — A Reflection of Who You Are
The figures in a Carbon Footprint report represent far more than emissions data. They are a statement of organizational accountability and transparency.
Choosing to ground your reporting in accurate, chemically verified data does two things at once:
Reduces the risk of reporting errors that could damage credibility or invite regulatory scrutiny
Builds a stronger foundation for long-term sustainability — one that holds up under audit, due diligence, and public disclosure
In an era where ESG performance is increasingly tied to business reputation and investment attractiveness, the quality of your data is the quality of your commitment.
The carbon numbers you report are only as strong as the data behind them. Make sure yours are built to last.
Learn more about ALS Testing’s Chemical Testing Services: https://www.alstesting.co.th/services/
Read more
February 23, 2026
