วิเคราะห์อนุภาค
- โชว์สินค้าทั้งหมด
- No categories
May 13, 2026

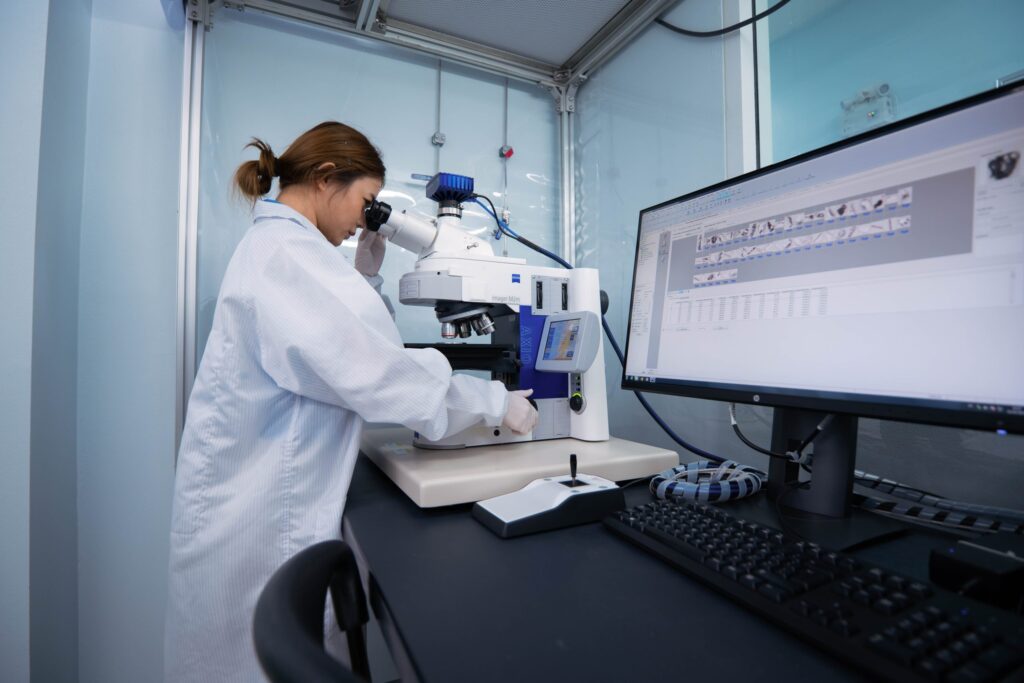
Particle & Contamination Analysis for Automotive Components
VDA 19 / ISO 16232 — Under ISO/IEC 17025 Accreditation
Why Cleanliness Is Critical in Automotive Manufacturing
In automotive manufacturing, invisible contamination can cause very visible — and very costly — failures. Microscopic particles left on components can block hydraulic systems, wear down precision surfaces, and trigger electronic malfunctions. That’s why the automotive industry has developed rigorous international standards to control component cleanliness.
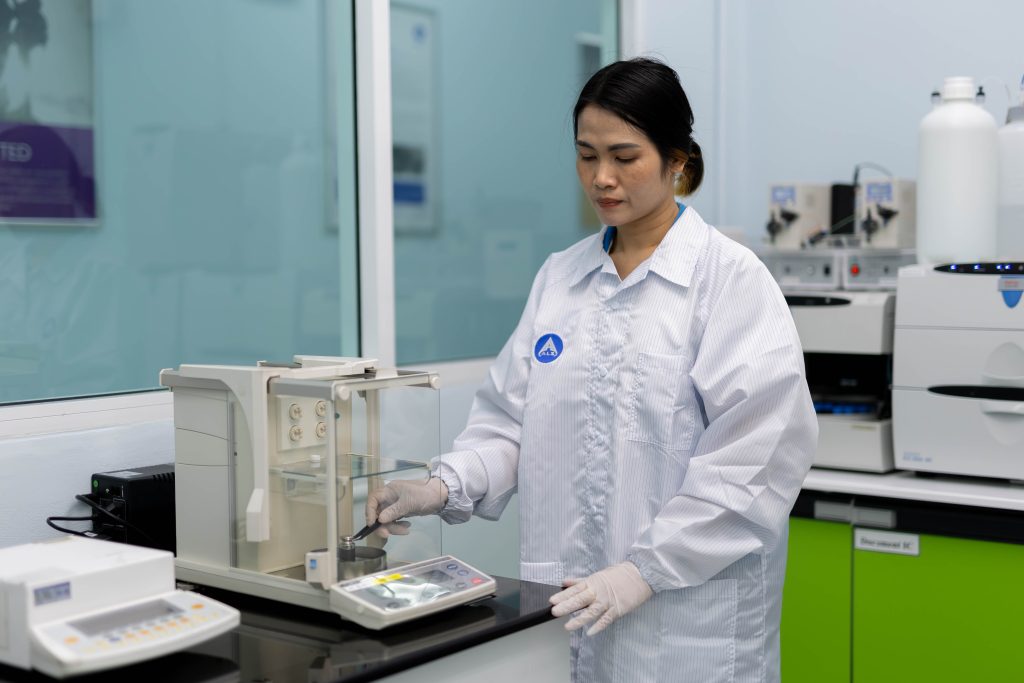
ALS Testing provides comprehensive particle measurement, counting, and analysis services for automotive components in full compliance with VDA 19 and ISO 16232:2018 — the two most important cleanliness standards in the global automotive supply chain — conducted within our fully ISO/IEC 17025 accredited laboratory.
Our testing goes beyond simple quality checks. It supports new product development, drives manufacturing process improvements, and provides the scientific data needed to protect product performance and safety in the field.
The Two-Stage Testing Process: VDA 19 / ISO 16232
ALS holds accreditation specifically covering ISO 16232 testing within the scope of our ISO/IEC 17025 certification. Our testing follows a structured two-stage methodology:
Stage 1: Decline Test — Validating Extraction Parameters
Before full particle analysis can begin, it’s essential to confirm that the extraction process itself is working correctly for your specific component. This is what the Decline Test establishes.
How it works:
The component undergoes a controlled extraction process to remove particles from its surface and internal passages
The extraction fluid is filtered through a membrane filter
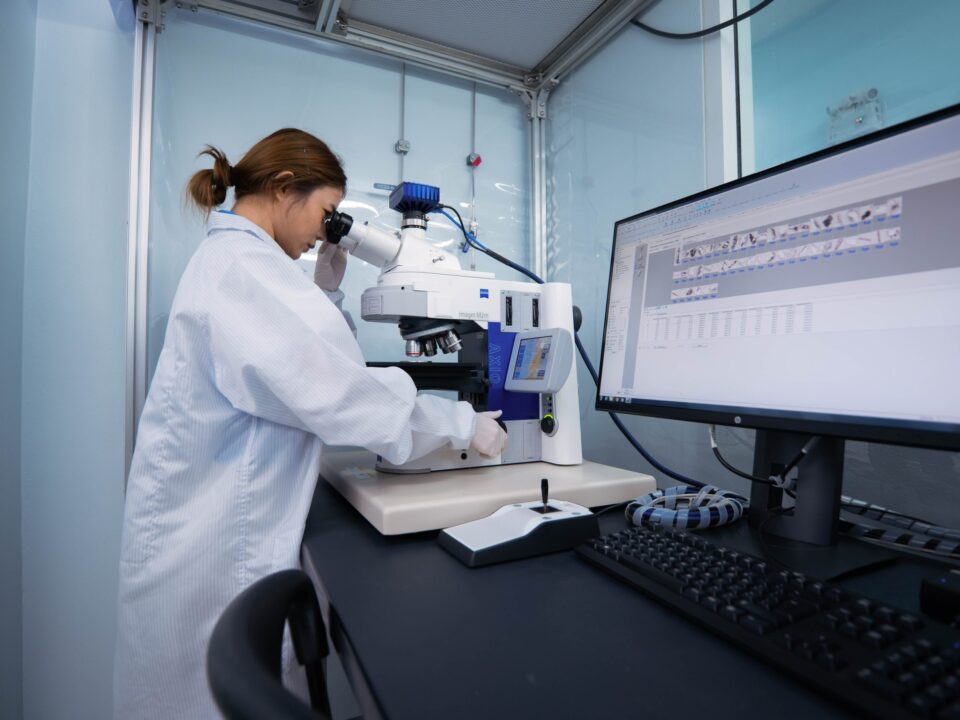
The filter is analyzed using a Particle Analyzer
This process is repeated six times on the same component, yielding six individual filter membranes
Results from all six filters are plotted on a graph and evaluated against VDA 19 / ISO 16232 acceptance criteria
✅ If the results meet the standard’s requirements, the extraction parameters are validated — and the process moves on to Stage 2.
Think of this as calibrating your measurement process before taking the actual measurement. It’s what separates reliable data from guesswork.
Stage 2: Particle Analysis — Size, Quantity, and Classification
With validated extraction parameters in place, the component undergoes its full particle analysis according to VDA 19 standards. The extraction fluid is filtered and the membrane is examined using a Particle Analyzer to determine:
Table
Parameter
What It Tells You
Quantity
How many particles are present
Size
The dimensional range of particles detected
Type
What the particles are made of
Particle Classification
All detected particles are categorized into three types:
Metallic — Metal particles from machining, wear, or assembly
Non-Metallic — Rubber, plastic, ceramic, or mineral particles
Fiber — Natural or synthetic fiber contamination
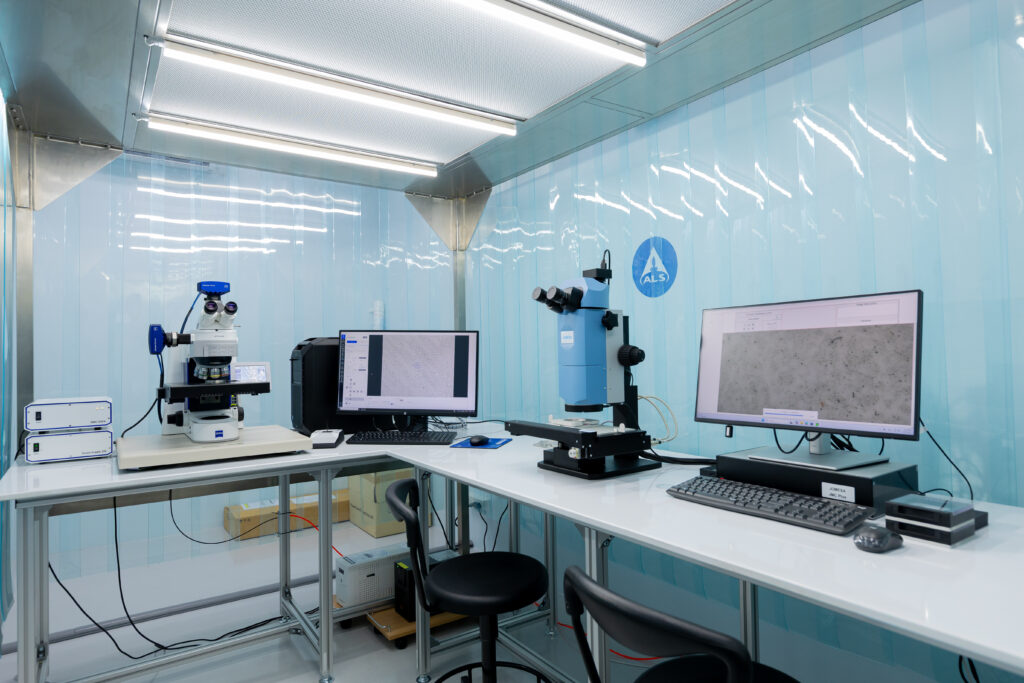
Going Deeper: Advanced Identification Techniques
When standard particle analysis isn’t enough — for example, when you need to know the exact elemental composition or chemical identity of a contaminant — ALS applies specialized analytical techniques.
For Metallic Particles: SEM/EDX Analysis
Scanning Electron Microscopy with Energy Dispersive X-ray Analysis (SEM/EDX) is the gold standard for characterizing metallic particles at the microscopic level.
How It Works
SEM directs a focused electron beam across the particle surface, generating high-resolution images that reveal surface morphology and structural detail at the micrometer scale
EDX detects the characteristic X-rays emitted when the electron beam interacts with atoms in the sample — effectively producing a unique elemental fingerprint for each material
What SEM/EDX Can Tell You
Table
Capability
Application
Elemental composition at micrometer level
Identify what metal alloy a particle came from
Chemical mapping across a surface
Visualize element distribution in coatings or alloys
Surface and structural defect analysis
Detect cracks, wear patterns, and coating failures
Corrosion characterization
Trace signs of oxidation or chemical attack
Coating thickness and layer analysis
Verify coating integrity and uniformity
Why It Matters
SEM/EDX doesn’t just identify that a metallic particle exists — it tells you exactly where it came from. That’s the information you need to trace contamination back to its source in the manufacturing process and fix it permanently.
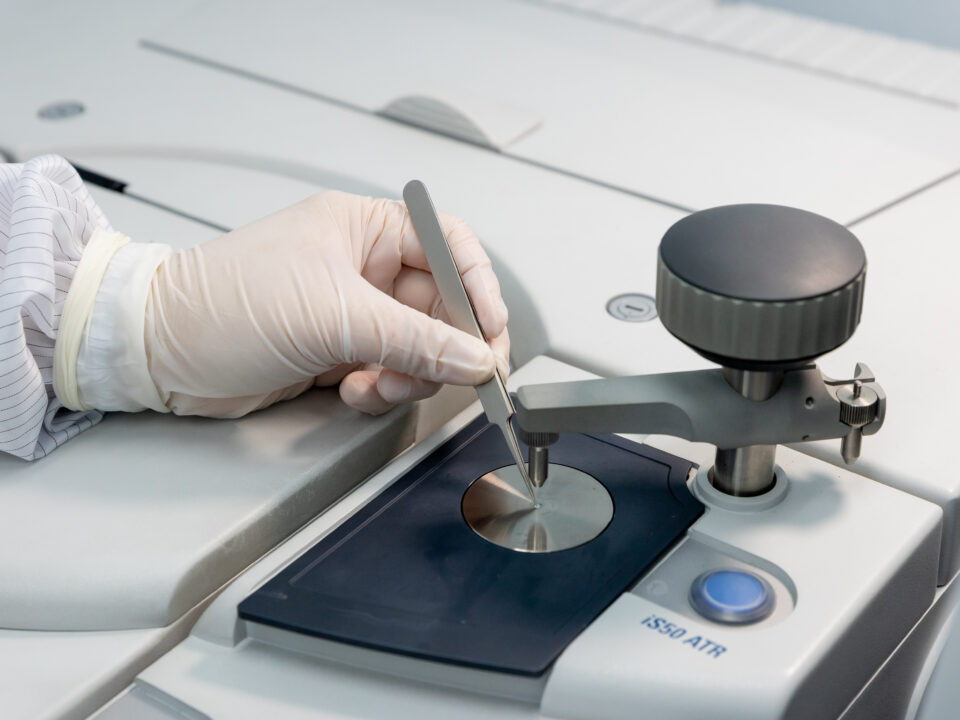
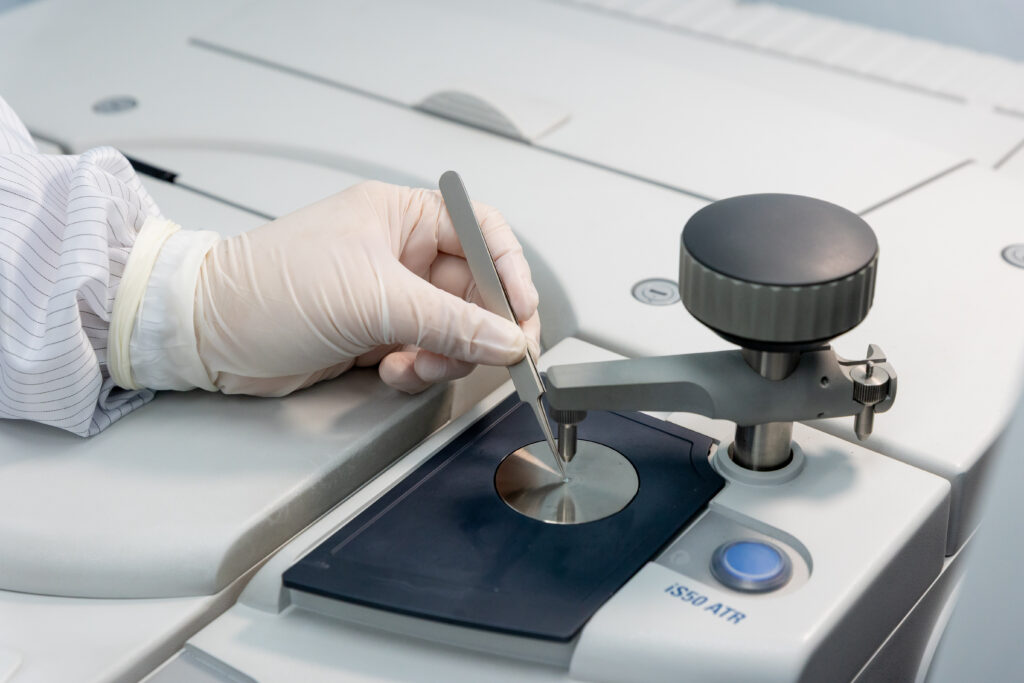
For Non-Metallic Particles & Fibers: FT-IR Analysis
Fourier Transform Infrared Spectroscopy (FT-IR) is the technique of choice for identifying non-metallic materials such as plastics, rubbers, resins, and fibers.
How It Works
Every chemical compound absorbs infrared light in a unique pattern — essentially a molecular fingerprint. FT-IR measures how a sample absorbs infrared radiation across different wavelengths, then matches that pattern against reference libraries to identify the material with high confidence.
Sample Types FT-IR Can Analyze
Table
State
Examples
Solid
Plastics, rubber, synthetic and natural fibers
Liquid
Cleaning agents, paints, oils, adhesives
Gas/Vapor
Volatile organic compounds
FT-IR Capabilities at ALS
High-Sensitivity MGT-A Detector — ensures precise, reliable measurements even at trace levels
Interchangeable Accessories (VATR, Liq-Cell, ZnSe Compression Cell) — enables analysis of samples in any physical state
Nicolet Nic-Plan Microscope — specialized for analyzing microscopic particles and trace contaminants
Applications
✅ Qualitative Analysis — Identify polymers, resins, adhesives, oils, and unknown contaminants ✅ Quantitative Analysis — Measure the concentration of specific chemical components in a sample
Key Advantages
Requires only a tiny sample — ideal for microscopic contaminants
Non-destructive — the sample can be preserved for further testing if needed
Fast and accurate — results are typically available quickly without complex preparation
Industries Served at ALS Pathumthani
FT-IR testing at ALS supports a broad range of sectors:
Automotive
Electronics & IT
Telecommunications
Plastics & Polymers manufacturing
Why Particle Analysis Matters to Your Business
Particle and contamination analysis isn’t just a laboratory exercise — it delivers measurable business value across the entire manufacturing operation.
✅ Tighter Quality Control
Understanding particle size and distribution enables manufacturers in automotive, food, pharmaceutical, and chemical industries to consistently meet product specifications — and catch deviations before they reach the customer.
⚙️ Optimized Production Processes
By monitoring particle characteristics in real time, manufacturers can fine-tune process conditions continuously — ensuring consistent output and reducing variability that leads to defects.
⏱️ Faster Problem Detection
Online particle analysis techniques enable real-time process monitoring, dramatically reducing the delays and blind spots associated with offline sampling. When something goes wrong, you find out immediately — not at the end of the production run.
Stronger R&D Capability
For research and development teams, particle analysis provides the material behavior data needed to design better products, develop new formulations, and understand how materials perform under real-world conditions.
Cross-Industry Applicability
The value of particle analysis extends well beyond automotive:
Table
Industry
Application
Food
Controlling powder particle size for texture and consistency
Pharmaceutical
Verifying drug particle size for efficacy and bioavailability
Chemical
Managing reagent and product particle size in manufacturing
Electronics
Detecting contamination in precision components
Reduced Production Costs
Better quality control means fewer defective products, less rework, and fewer costly recalls. Investing in particle analysis pays for itself through the waste and failure costs it prevents.
Why Choose ALS for VDA 19 / ISO 16232 Testing?
Table
What We Offer
What It Means for You
✅ ISO/IEC 17025 accredited
Results recognized internationally
Full VDA 19 / ISO 16232 scope
End-to-end testing under a single accredited roof
⚙️ Advanced SEM/EDX & FT-IR capability
Deep-dive identification when standard analysis isn’t enough
Experienced specialist team
Accurate analysis and actionable interpretation
Comprehensive reporting
Clear results ready for customer submission or internal QC
Ready to take control of component cleanliness? Contact ALS Testing Services (Thailand) Co., Lt. today to discuss your VDA 19 / ISO 16232 testing requirements — and let our experts help you meet the standards your customers and partners demand.
Tel: +(66) 2700 9665
Email: pathumthani@alsglobal.com
Read moreMay 7, 2026

In industries like automotive, electronics, and medical devices, cleanliness is not optional — it’s a fundamental requirement. Even microscopic dust particles can compromise product quality, trigger costly recalls, and damage your brand’s reputation. That’s why Dust Analysis (Particle Analysis) is a critical step that gives manufacturers the confidence their products meet both domestic and international standards.
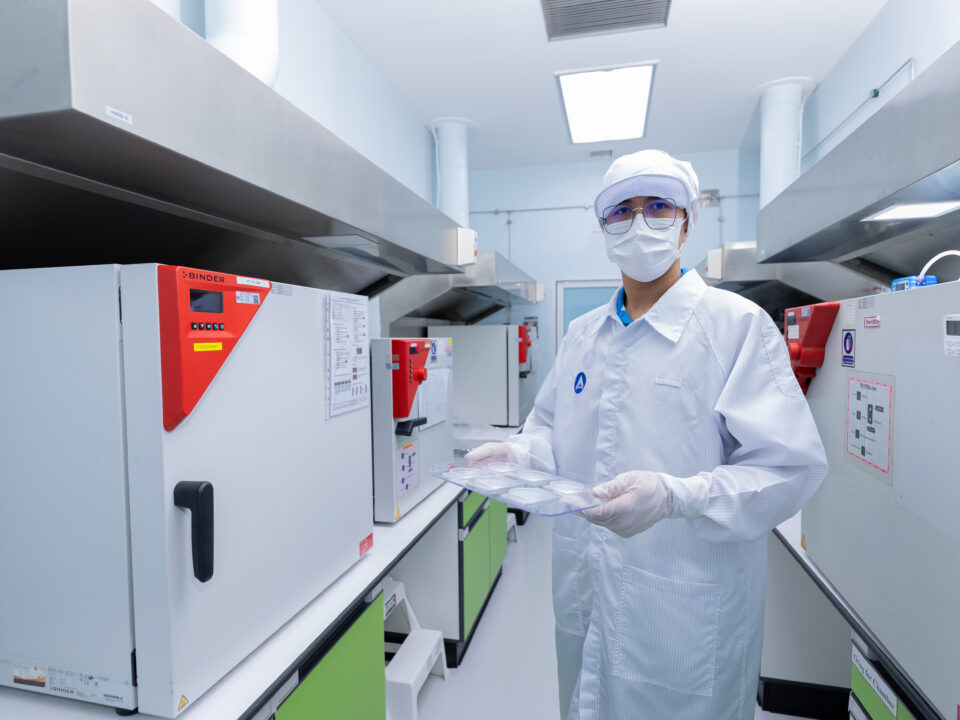
ALS Testing Services (Thailand), a member of the ALS Global network with over 40 years of testing and quality inspection expertise, offers comprehensive, internationally accredited dust analysis services — helping businesses elevate product quality and reduce production risk.
What Is Dust Analysis?
Dust Analysis is the process of detecting, measuring, and classifying particulate contaminants found in components, finished products, or production environments. Using specialized tools and standards, it evaluates whether contamination levels affect:
✅ Product quality and performance
✅ Safety requirements
✅ International standards such as VDA 19 (Technical Cleanliness of Components) and ISO 16232:2018 (Cleanliness of Components in Automotive Manufacturing)
ALS Testing’s 3-Step Dust Analysis Service
Step 1: Validation of Extraction Parameters
Before analysis begins, we verify that the particle extraction method is appropriate for your specific component. This involves 6 repeated extractions, analyzed through a Particle Analyzer — ensuring accuracy and full compliance with VDA 19 / ISO 16232 criteria.
Step 2: Particle Analysis
Once extraction is validated, the extracted particles are classified into three main categories:
Table
Category
Examples
Metallic
Iron, aluminum, and copper shavings from wear and machining
Non-Metallic
Plastic, rubber, or environmental dust particles
Fiber
Threads from fabric, filters, or packaging materials
Results specify the quantity, size, and type of each particle — enabling manufacturers to assess whether their components meet cleanliness standards and to plan precise maintenance actions.
Step 3: Advanced Analysis
When deeper identification is needed, ALS Testing offers cutting-edge analytical technologies:
SEM/EDX (Scanning Electron Microscopy with Energy-Dispersive X-ray Analysis) — identifies the elemental composition of metallic particles
FTIR (Fourier Transform Infrared Spectroscopy) — identifies non-metallic particles such as plastics, rubber, and natural fibers
4 Business Benefits of Dust Analysis
1. ️ Reduce the Risk of Product Recalls
By detecting contamination before products reach customers, dust analysis helps you catch problems at the source — preventing costly recalls, economic losses, and damage to customer trust.
2. Compete Confidently in Global Markets
International markets — especially automotive, electronics, and medical — enforce strict cleanliness requirements. Standards-compliant dust analysis confirms your products are ready for these markets, opening doors to new trade opportunities.
3. ⚙️ Improve Production Process Efficiency
Particle data reveals contamination rates and their origins — whether from machinery, the work environment, or assembly steps. This actionable intelligence allows manufacturers to eliminate risk points and optimize production for the long term.
4. Build Customer and Partner Confidence
Test results from an ISO/IEC 17025-accredited laboratory provide tangible proof of quality — giving customers and business partners the assurance that your products undergo rigorous quality control. This is a powerful foundation for building lasting business relationships.
Which Industries Benefit from Dust Analysis?
Dust analysis isn’t limited to automotive alone. Here’s how it adds value across multiple sectors:
Food & Beverage
Dust and particles from packaging, machinery, or the environment can contaminate food products and cause failures under safety standards like HACCP, GMP, or ISO 22000. ALS particle analysis pinpoints contaminant types and sources — enabling targeted fixes such as improved packaging steps or upgraded air filtration systems.
Cosmetics & Personal Care
In skincare and cosmetics production, tiny particles — dust, fibers, or material fragments — can cause skin irritation, adverse reactions, or product degradation. Dust analysis helps manufacturers identify and eliminate contamination before products reach consumers.
⛽ Energy & Petrochemical
Dust particles, metal debris, and sediment deposits can cause blockages, accelerated wear, and equipment damage that disrupts operations. Regular particle analysis keeps pipes, hydraulic systems, and process equipment clean — maintaining both safety and operational efficiency.
Elevate Your Quality Standards with ALS Testing Services
In today’s highly competitive industrial landscape, cleanliness standards are not a box to check — they are a strategic quality tool. Neglecting dust analysis risks product defects, regulatory non-compliance, and reputational damage that is far more costly than the test itself.
ALS Testing Services (Thailand) is your trusted partner — backed by 40+ years of ALS Global expertise, world-class analytical standards, advanced technology, and clear, actionable reports designed to help you improve, compete, and grow.
Achieve world-class cleanliness confidence — with ALS Testing Services.
Read moreMay 7, 2026
In the automotive industry, precision is everything. Countless components operate within hydraulic systems, oil circuits, and delicate mechanisms where even the tiniest foreign particle can cause serious problems. Yet one quality factor that manufacturers often overlook — despite its significant impact — is particle cleanliness.
Microscopic metal shavings, plastic fragments, or tiny fibers invisible to the naked eye can silently compromise the performance and lifespan of critical components. That’s why particle analysis is no longer just an inspection task — it’s a core pillar of any robust quality management system.
The Standards Behind the Science: VDA 19 & ISO 16232
Two internationally recognized standards govern particle cleanliness testing in the automotive world:
Table
Standard
Role
VDA 19
Provides procedural guidelines and test methods
ISO 16232
Establishes universal criteria for communication between OEMs and suppliers
Using both standards together ensures that particle analysis results are globally comparable, traceable, and credible — making it easier for factories to benchmark quality and meet OEM expectations.
Why Does It Matter?
Even particles just a few microns in size can trigger unexpected failures, such as:
Blocked oil channels in hydraulic systems
Increased friction and wear in precision moving parts
Stiffening of mechanical components, reducing responsiveness
False signals in electronic systems, causing malfunctions
Think of particle analysis as a preventive health check for your production line — identifying contamination risks before they turn into real-world failures.
How Particle Analysis Works: A 2-Step Process
Step 1: Decline Test — Validating Extraction Parameters
The first step under VDA 19 is the Decline Test, which verifies that the particle extraction method is appropriate for the specific component being tested. This confirms that all potentially contaminating particles are consistently extracted — with no variability caused by equipment or methodology.
⚠️ If the Decline Test fails, it signals instability in the production or cleaning process — which must be corrected before proceeding to the main analysis.
Step 2: Particle Analysis — Classification and Quantification
Once extraction is validated, particles are categorized into three groups:
Metallic — metal shavings or fragments from machining
Non-Metallic — plastic, rubber, or other solid particles
Fiber — thread-like contaminants from packaging or assembly
This classification tells manufacturers not just how many particles are present, but what type, what size, and — critically — where they came from: machining, assembly, surface finishing, or even component packaging.
4 Real Business Benefits of World-Class Particle Testing
1. ⬇️ Reduce Scrap and Production Costs
Once the source of contamination is pinpointed, targeted corrective actions — such as improving washing steps or adding dust protection — lead directly to lower scrap rates and more stable production output.
2. Boost Supplier Credibility with OEMs
Reporting to ISO 16232 means your results speak a universal language that OEMs understand and trust — eliminating interpretation gaps and positioning your factory as a reliable, quality-controlled supplier.
3. Enable Continuous Process Monitoring
Particle data allows factories to track cleanliness trends over time, enabling proactive maintenance planning and preventing quality issues from ever reaching the customer.
4. Build the Foundation for Zero Defect Manufacturing
By controlling quality at the particle level, factories can detect defects that are completely invisible to the human eye — moving steadily closer to the Zero Defect goal through data-driven, precisely targeted improvements.
Comprehensive Particle Cleanliness Testing with ALS Testing
For manufacturers committed to systematic cleanliness improvement, conducting particle analysis under VDA 19 and ISO 16232 within an ISO/IEC 17025-accredited laboratory is an essential step — one that reduces quality risk and aligns your processes with the expectations of global automotive manufacturers.
ALS Testing delivers a complete end-to-end service covering every stage:
✅ Custom extraction condition design for each component type ✅ Filtration, particle counting, and classification ✅ Categorization per VDA 19 / ISO 16232 criteria ✅ Detailed reports ready for direct OEM submission
The results can be immediately applied to improve production processes, plan waste reduction, and establish internal cleanliness standards aligned with your business goals.
Whether you’re looking to stabilize production, reduce scrap, strengthen OEM alignment, or lay the groundwork for Zero Defect Manufacturing — particle cleanliness analysis with ALS Testing is the confident first step toward getting there.
Read moreMay 6, 2026

Why Chemical Testing Is the Foundation of Credible ESG Reporting
Numbers Only Matter If They Are Right
Every organization calculating its Carbon Footprint is working toward the same goal: an accurate, credible, and defensible picture of its greenhouse gas emissions. But here is the question most overlook —
How reliable is the data behind those numbers?
Carbon Footprint reporting, as defined by frameworks like the GHG Protocol and ISO 14064, is fundamentally a calculation. It takes Activity Data — fuel consumed, waste generated, refrigerants used — and multiplies it by established Emission Factors to estimate total greenhouse gas output.
The formula is standardized. The methodology is clear. But if the input data is inaccurate, even a perfectly executed calculation produces a misleading result.
This is exactly where chemical testing becomes essential.
What Is Chemical Testing — and What Does It Have to Do with Carbon?
Chemical testing is the process of collecting and analyzing samples from environmental media — air, water, soil, waste streams, and process gases — using standardized methods and equipment. The goal is to determine concentration, composition, and potential impact on the environment, human health, or regulatory compliance.
In the context of Carbon Footprint reporting, chemical testing is not about measuring carbon directly in a lab. Rather, it is about validating the quality of Activity Data — ensuring that what goes into the calculation actually reflects what is happening on the ground.
Carbon Footprint is the calculation. Chemical testing is what makes the inputs worth calculating.
Where Chemical Testing Makes a Real Difference
In complex industrial operations, relying on generic averages or assumptions introduces significant margin for error. Chemical analysis replaces those assumptions with real, site-specific data:
Table
Application
How It Improves Accuracy
Fuel Heating Value Analysis
Uses actual calorific value instead of generic averages
Stack Gas Measurement (CO₂, CH₄, N₂O)
Directly assesses combustion efficiency and emission rates
Wastewater COD Analysis
Calculates methane generation potential from treatment systems
❄️ Refrigerant Identification (HFCs, PFCs)
Ensures the correct Global Warming Potential (GWP) value is applied
Raw Material Composition Analysis
Supports accurate Scope 3 emission assessments
In each of these cases, chemical testing acts as a data verification layer — not replacing the Carbon Footprint calculation, but making the data that feeds it far more trustworthy.
Why Data Integrity Is Non-Negotiable
A Carbon Footprint report that earns stakeholder trust is not just mathematically correct — it is traceable, transparent, and verifiable. The factors that determine credibility go beyond the calculation itself:
✅ How Activity Data was collected and recorded
✅ Whether international standards are clearly referenced
✅ Internal quality control systems in place
✅ Transparency throughout the reporting process
Within the broader ESG framework — particularly on the environmental and governance dimensions — verifiable data is the bedrock of long-term credibility. Investors, regulators, customers, and partners are increasingly asking not just “What is your carbon footprint?” but “How do you know?”
More Than a Statistic — A Reflection of Who You Are
The figures in a Carbon Footprint report represent far more than emissions data. They are a statement of organizational accountability and transparency.
Choosing to ground your reporting in accurate, chemically verified data does two things at once:
Reduces the risk of reporting errors that could damage credibility or invite regulatory scrutiny
Builds a stronger foundation for long-term sustainability — one that holds up under audit, due diligence, and public disclosure
In an era where ESG performance is increasingly tied to business reputation and investment attractiveness, the quality of your data is the quality of your commitment.
The carbon numbers you report are only as strong as the data behind them. Make sure yours are built to last.
Learn more about ALS Testing’s Chemical Testing Services: https://www.alstesting.co.th/services/
Read moreMay 6, 2026
ICE vs. EV: A New Kind of Risk
The shift from combustion engines (ICE) to electric vehicles (EV) changes more than the power source — it changes the entire risk profile.
ICE systems fail through mechanical wear — predictable, repairable.
EV systems fail through electrical faults and thermal instability — sudden, dangerous, and potentially irreversible.
Even a few microns of contamination can trigger a battery short circuit, leading to thermal runaway — and potentially fire or explosion.
Why ISO 16232 Now Matters for Safety
The updated VDA 19.1 (3rd Edition, 2025), developed by 40+ leading automotive companies, elevates ISO 16232 from a quality standard to a functional safety requirement, introducing:
Particle analysis below 50 microns
SEM/EDX inspection techniques
Standardized dry extraction methods
Failure assessment for battery and electronic components
How Contamination Causes EV Failures
In high-voltage EV systems (400–800V), small conductive particles can cause:
Short circuits
Electrical arcing
Insulation breakdown
Leakage currents
These failures occur without warning — making cleanliness a safety-critical design requirement, not just a quality checkpoint.
ICE vs. EV: Quick Comparison
Table
Factor
ICE
EV (High Voltage)
Main Risk
Mechanical wear
Short circuit / Thermal instability
Critical Particle Size
> 100 µm
< 50 µm
Primary Impact
Performance loss
Arcing, insulation failure
ISO 16232 Role
Quality standard
Functional safety standard
ISO 16232 in the EV Supply Chain
ISO 16232 is evolving from a measurement tool into a full process control framework:
Cleanliness limits tied to failure mechanisms
Integrated with PFMEA / DFMEA
Supported by real-time monitoring and traceability
The Road to Zero Contamination
To stay competitive, organizations should:
✅ Embed cleanliness into product design from day one ✅ Invest in SEM/EDX and real-time inspection tools ✅ Build data-driven process controls ✅ Train personnel and foster a quality-first culture
FAQ
Why are small particles more dangerous in EVs? High-voltage systems have lower insulation tolerance. Particles under 50 µm can instantly cause short circuits and trigger thermal runaway.
How does cleanliness relate to Functional Safety? Contamination can initiate electrical bridging and insulation failure — making it a direct concern under ISO 26262.
Where should organizations start? Define cleanliness requirements based on failure mechanisms, then integrate them into design, manufacturing, and inspection — supported by SEM/EDX and traceability systems.
What are the long-term benefits of compliance? Fewer recalls, reduced thermal and electrical failures, longer system lifespan, and stronger trust from OEM customers.
Read moreMay 6, 2026
Introduction
In the modern automotive industry, component precision and reliability are paramount — particularly with the growing adoption of intelligent braking systems, high-pressure fuel systems, and electric vehicles. One critical aspect often overlooked is technical cleanliness: the control of micron-level particles that can cause blockages, wear, and damage to critical systems, ultimately leading to costly product recalls.
Establishing a Cleanliness Lab aligned with Tier 1 Automotive standards is therefore not merely a compliance requirement — it is a strategic risk management initiative.
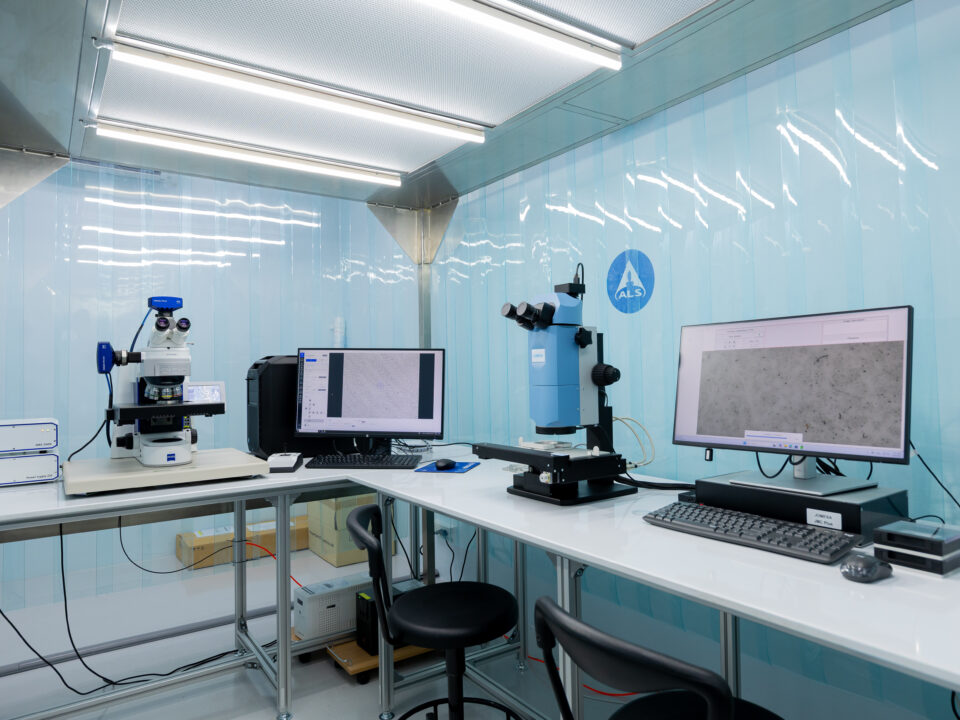
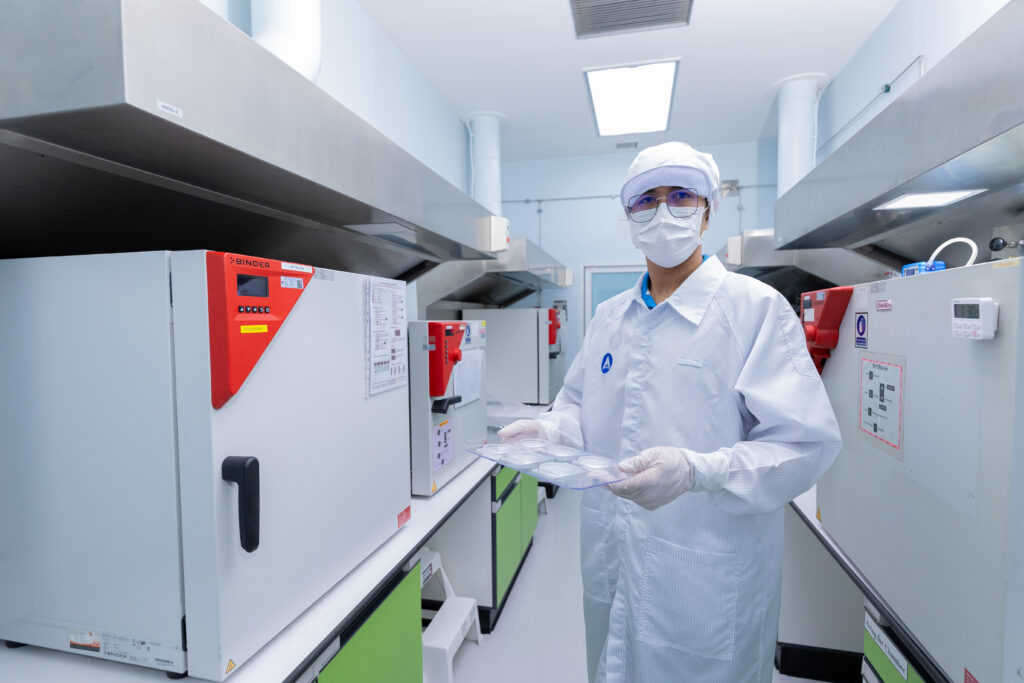
What is a Cleanliness Lab?
A Cleanliness Lab is a controlled laboratory facility designed to assess the cleanliness of automotive components through particle extraction and analysis, ensuring contamination levels remain within defined specifications.
For Tier 1 Suppliers, the lab functions as a quality gateway prior to OEM delivery — verifying product conformance, reducing rejection risk, and strengthening customer confidence. Applicable standards include ISO 16232 and VDA 19, both of which define systematic and reproducible testing methodologies. Organizations that meet these standards gain a competitive advantage within the global automotive supply chain.
Laboratory Infrastructure Requirements
Reliable test results depend on a well-designed facility. Key infrastructure elements include:
Cleanroom controlled to ISO Class 5–8
HEPA filtration system to minimize airborne particle levels
Positive pressure system to prevent external air ingress
Segregated zones for sample preparation, extraction, and analysis
One-way flow layout to minimize cross-contamination
Essential Equipment
Equipment
Function
Significance
Particle Extraction System
Extracts particles from test components
Core step of the testing process
Microscope
Analyzes particle size and morphology
Enables detailed characterization
Particle Counter
Quantifies particle count
Comparison against standard limits
Vacuum Filtration Unit
Filters test samples
Prepares samples for analysis
Laminar Flow Cabinet
Controls local environment
Reduces contamination risk
Standard Testing Workflow
The cleanliness testing process comprises five core steps:
Sample Collection
Particle Extraction
Filtration
Analysis
Reporting
To ensure process reliability and integrity, the following must also be in place:
Clearly defined Standard Operating Procedures (SOPs)
Blank testing for quality control verification
Process validation
Traceability systems and data integrity controls
Personnel Competency
Despite advances in technology, personnel remain the most critical factor in Cleanliness Lab quality assurance. Required competencies include laboratory instrument operation, particle analysis techniques, and a working knowledge of ISO and VDA standards. Organizations must maintain continuous training, competency assessments, and periodic skill reviews.
Human factors also represent a significant contamination risk — including improper gowning, deviation from SOPs, and inappropriate behavior within the cleanroom — all of which can directly compromise test accuracy and overall system reliability.
Development Challenges
Building a Cleanliness Lab presents several challenges:
Capital investment for cleanroom construction and specialized equipment procurement
Standard complexity requiring expert knowledge for accurate interpretation and implementation
Upstream process control — an unstable manufacturing process limits the effectiveness of laboratory testing alone
Organizations are advised to develop both manufacturing controls and laboratory capabilities concurrently to achieve sustainable Tier 1 compliance.
Future Outlook: Smart Cleanliness Lab
The next generation of cleanliness laboratories is evolving toward intelligent, automated systems, incorporating:
AI-powered particle analysis
Automated microscopy
Real-time data connectivity
Integration with manufacturing execution and quality management systems enables end-to-end quality control, reducing cycle time, improving result consistency, and supporting compliance with increasingly stringent industry standards.
From Compliance to Competitive Advantage
A Cleanliness Lab is not merely a testing facility — it is an integral component of a holistic quality management system, spanning product design, manufacturing, and delivery. Organizations that establish a fully compliant Cleanliness Lab will be well-positioned to meet OEM requirements, reduce long-term operational risk, and sustain competitiveness in the global automotive market.
Investment in a Cleanliness Lab is an investment in long-term business sustainability.
FAQ
Is a Cleanliness Lab required for all manufacturing facilities? Not universally — however, it is essential for high-precision or safety-critical components, particularly in electric vehicle, electronics, and stringent-cleanliness applications.
How should an organization begin? Conduct a Gap Analysis against ISO 16232 and VDA 19, then develop a structured implementation plan covering facility design, equipment, and process requirements.
What is the estimated budget? Costs range from hundreds of thousands to several million baht, depending on lab scale, technology scope, and target compliance level.
How long does implementation take? Typically 3–12 months, subject to organizational readiness and system complexity.
What are common implementation mistakes? Inadequate facility design, unclear SOPs, insufficient personnel training, and failure to address upstream process control — resulting in test outcomes that do not reflect real-world conditions.
Read moreApril 17, 2026
Dust analysis in factories: testing methods and ISO standards that factories need to know.
The growth of the EV and semiconductor industries has made particle control in manufacturing lines a key global issue, with the particle analysis services market valued at over $1 billion and expected to grow at an average rate of over 8% per year.
Particle analysis is the process of examining the size, quantity, and composition of particulate matter contaminating air, surfaces, or product components. This is done to assess risk and ensure quality control meets industry standards. Many manufacturing industries require strict air cleanliness control according to ISO 14644 standards.
This article will help you understand how dust analysis works, the types of instruments used, and why particle control has become a core part of quality control in modern factories.
Why is the Particle Analysis Market Growing So Rapidly?
Controlling particle contamination is a critical issue in advanced industries, particularly semiconductor and electronics manufacturing, which require cleanrooms with strict particle control.
According to global industry organizations, the particle analysis services market is worth over a billion dollars and is growing at an average rate of 8–9% per year.
This growth is primarily driven by three factors:
Quality and hygiene regulations in industry.
The growth of the EV and semiconductor industries.
Continuously evolving analytical technologies such as AI and real-time monitoring systems.
As production lines become more complex, dust analysis has become an integral part of quality control systems, not just general environmental monitoring.
The Dust Situation in Thailand: From PM2.5 to Production Processes
Thailand faces a recurring PM2.5 dust problem. Data from the Pollution Control Department (PCD) indicates that many areas of the country have annual PM2.5 averages higher than the World Health Organization’s guideline of 5 micrograms per cubic meter, as per WHO Air Quality Guidelines.
The PCD report also states that PM2.5 sources in Thailand come from various sectors, such as:
Transportation
Open burning
Industrial sector
Energy production
While PM2.5 information is often discussed in a health context, in the manufacturing sector, process particles are also a significant risk.
These particles can originate from metal scraps from machining, plastic powder from molding, or dust from machine wear, and can directly affect product quality.
How many types of dust are there in a production line, and how do they differ?
In industry, dust analysis is divided into two main groups based on particle origin: Airborne Particles and Component Cleanliness, which require different testing methods and reference standards.
Airborne Particles
Component Cleanliness
Type
Floating in the air in the production area.
Stuck on a surface or in a part.
Main factors
From the movement of people, machinery, and manufacturing processes.
From metal scraps, plastic powder, and wear and tear dust.
Main industry
Semiconductor, Medical Devices, Cleanroom
Automotive, EV, and Automotive parts
Standard
ISO 14644
VDA 19 / ISO 16232
Testing
LPC, Optical Microscope
SEM/EDX, Optical Microscope, IC
ALS
✓
✓
As manufacturing processes become more complex, dust monitoring has become part of a quality control system, not just an environmental test.
Laboratory Dust Analysis Methods
Laboratory dust analysis uses a variety of instruments depending on the particle characteristics and the context of the manufacturing process, including:
Optical Microscope
SEM/EDX (Scanning Electron Microscope with Energy Dispersive X-ray)
LPC Particle Counter (Liquid Particle Counter)
GC-MS (Gas Chromatography–Mass Spectrometry)
Ion Chromatography (IC)
Standards used in industrial dust analysis
Industrial particulate matter analysis must adhere to internationally recognized standards so that test results can be used in quality control and inspection processes.
Commonly encountered standards include:
Automotive & EV
Semiconductors and Electronics
Medical Devices
Aerospace
Food & Pharmaceutical
How long does dust analysis take?
The timeframe depends on the testing method. For example,
particulate matter measurement using ISO16232/VDA19 may take approximately 7-10 business days.
In an era of increasingly stringent manufacturing standards, the visibility and control of particles in production processes have become an integral part of a factory’s quality management system. Dust analysis is not just a technical test; it’s a crucial tool that helps manufacturers understand production process risks and consistently maintain international product standards.
For dust analysis or particle monitoring in your production process, ALS Testing Services (Thailand) Co., Ltd. offers services with an ISO/IEC 17025 certified laboratory.
Read more
February 23, 2026

