News & Promotion
- โชว์สินค้าทั้งหมด
- No categories
July 15, 2026
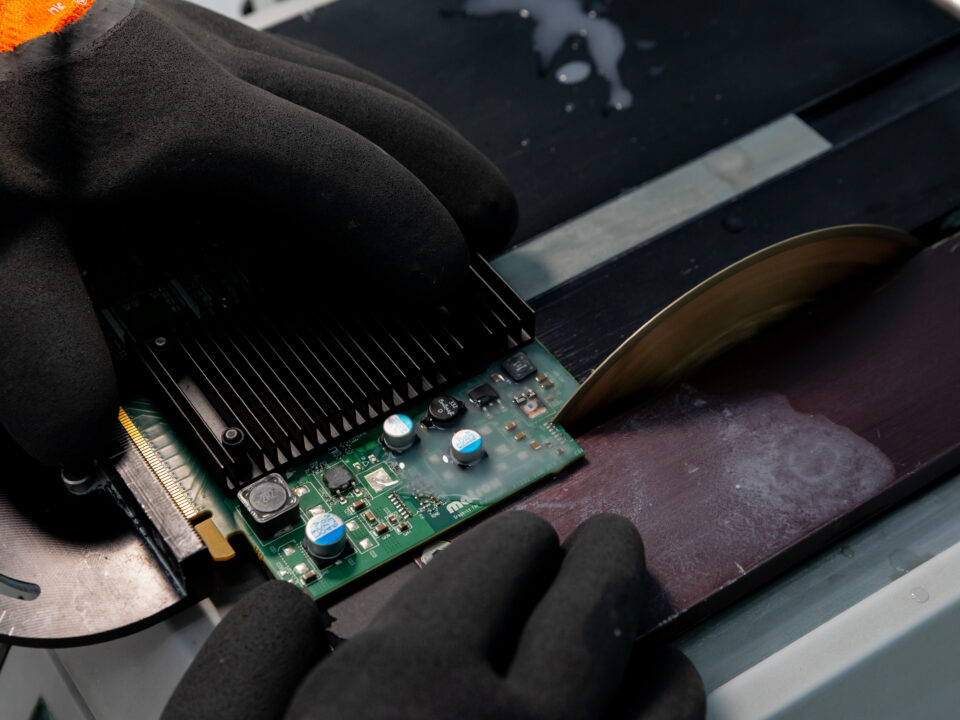
Particle Extraction · Gravimetric Analysis · Microscopic Sizing and Counting · Particle Classification · SEM-EDX Identification
ISO/IEC 17025 Accredited Testing Where Applicable | Automotive Cleanliness Workflow | Automotive Specialist
A particle smaller than a tenth of a millimetre can affect a hydraulic valve, score a fuel injector nozzle, or interfere with a narrow control orifice. The risk depends on the component, the clearance, the material, and the cleanliness limit defined by the OEM or customer specification.
In automotive manufacturing, particle analysis is a technical cleanliness workflow used to extract, count, size, classify and identify particulate contamination on automotive components. It helps manufacturers understand how much contamination is present, how large the particles are, and what materials they are made of.
The results are commonly used for components where particles may affect hydraulic flow, fuel injection, lubrication, cooling, sealing or electronic reliability, then compared against ISO 16232, VDA 19.1, OEM specifications or customer cleanliness limits.
What Is Particle Analysis
A complete particle analysis workflow usually looks at three practical areas.
What the test checks
Why it matters
Total particle mass
Shows the overall contamination load on the component
Particle count and size distribution
Shows whether particles exceed the defined size or count limits
Particle type or material
Helps identify whether the contamination is metallic, non-metallic, fibrous, organic, mineral or another material type
No single measurement gives the full picture. A component may have a low total particle mass but still contain one large metallic particle that could interfere with a valve or precision bore. Another component may have many small particles but still remain within the agreed cleanliness requirement. Particle analysis combines mass, size distribution and particle type so that manufacturers and OEMs can evaluate cleanliness against a defined specification.
For a full comparison of how cleanliness requirements are handled under the two main automotive cleanliness frameworks, see our companion article on ISO 16232 vs VDA 19.
How the Particle Analysis Workflow Works
Particle analysis is not a single test. It is a controlled workflow that moves from extraction to quantification, characterisation and reporting.
Stage
What happens
Main output
Extraction
Particles are removed from the component using a controlled method
Extracted particles in liquid or on a collection medium
Quantification
Particles are weighed, counted and measured
Particle mass, count and size distribution
Characterisation
Particles are classified or identified by material type
Metallic, non-metallic, fibre, polymer, mineral or elemental information
Reporting
Results are compared with the specified cleanliness requirement
Cleanliness code, particle limits or customer report format
This workflow is applied to functionally relevant surfaces, internal channels and component areas where contamination could affect performance, reliability or acceptance by the customer.
Particle Extraction Methods
Before particles can be counted or identified, they must be removed from the component in a controlled way. The purpose of extraction is to collect contamination from the relevant surfaces without adding particles from the test environment, solvent, equipment or handling process.
The extraction method depends on component geometry, surface condition, component weight, cleanliness requirement and whether the component can safely contact liquid.
Extraction method
Use when
Notes
Agitation
Components with simple shapes and open internal cavities
Useful for accessible surfaces and parts that can tolerate immersion
Pressure rinsing
Relevant surfaces or channels can be reached by controlled liquid flow
Suitable for defined flow paths, surfaces and internal areas
Ultrasonic extraction
The component has complex surfaces, recesses or difficult geometry
Helps dislodge particles from areas that direct rinsing may not reach
Air jet extraction
The component should not contact liquid
Used only when particles can still be captured and controlled for analysis
Before an extraction method is used for production testing, it should be validated for the component and requirement. A declining extraction curve is commonly used to show that repeated extraction cycles produce a decreasing particle count. This helps confirm that the method is removing the available contamination rather than leaving a significant unmeasured residue.
A blank value test is also important. It checks the cleanliness of the extraction equipment, solvent, membrane and test environment before the component result is interpreted. If the blank value is too high, the result may be distorted by particles introduced during the test process rather than particles from the component itself.
Particle Quantification Methods
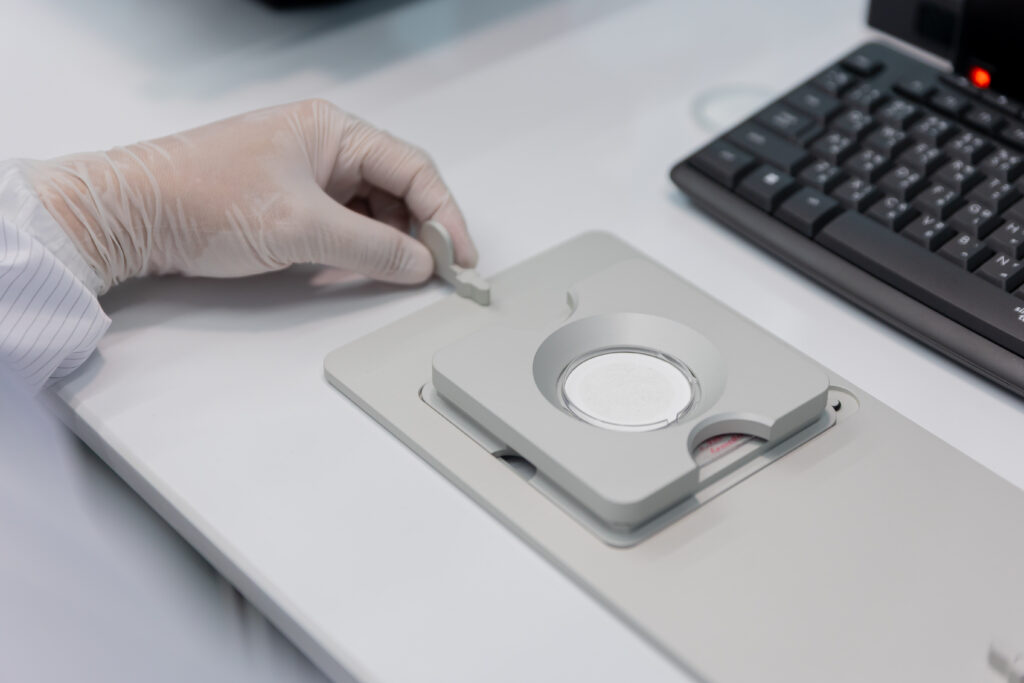
After extraction, the liquid is filtered through a membrane so that particles can be collected and analysed. In the ALS workflow shown in the reference material, the analysis includes gravimetric measurement and microscopic sizing and counting on the filter membrane.
Method
What it measures
Why it matters
Limitation
Gravimetric analysis
Total mass of particles collected on the membrane
Gives a fast overall contamination index
Does not show particle size distribution
Microscopic sizing and counting
Particle count and size range on the filter membrane
Shows whether particles exceed count or size limits
Requires a validated microscope and image analysis method
Liquid particle counting where specified
Particles suspended in liquid
May be used when the customer or method requires it
Should not be confused with membrane-based microscopic counting
Gravimetric analysis is useful because it shows the overall contamination load. However, mass alone does not show whether the contamination comes from many small particles or one oversized particle. This matters because a single large metallic particle can create more functional risk than a higher number of smaller particles within specification.
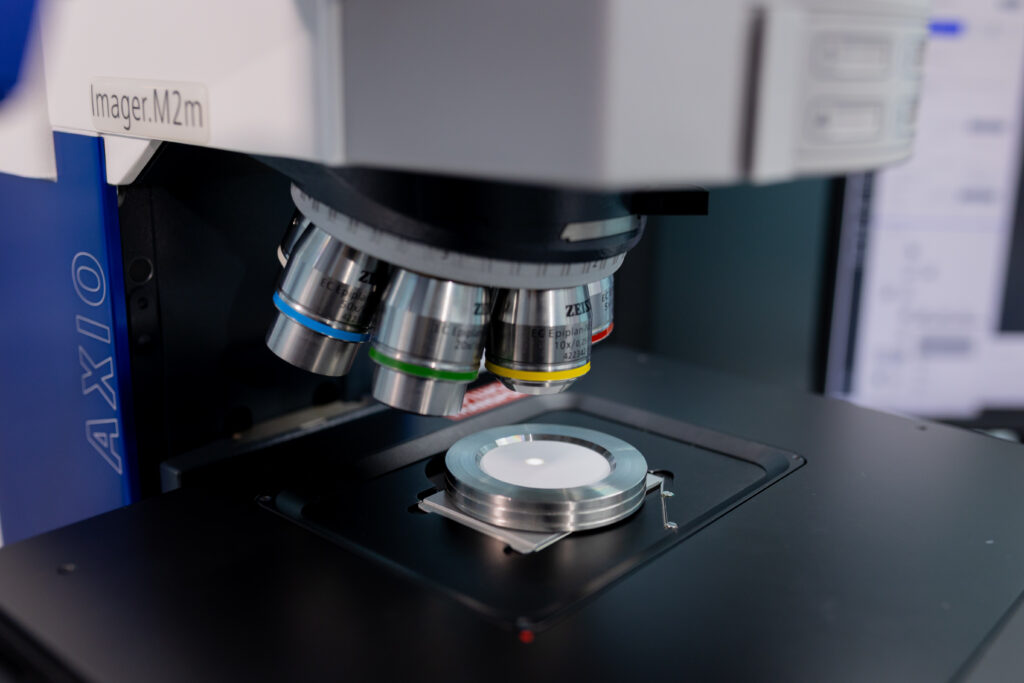
Microscopic sizing and counting addresses this gap. The filter membrane is examined using a calibrated microscope and image analysis system. Particles are counted, measured and grouped into defined size ranges. This provides the size distribution data needed to evaluate the component against the cleanliness code or particle count limits defined by the customer, ISO 16232, VDA 19.1 or the relevant reporting template.
Particle Characterisation and Material Identification
Quantification shows how many particles are present and how large they are. Characterisation helps explain what the particles are and where they may have come from.
Particle or method
What it indicates
Why it matters
Metallic shiny particles
Possible machining, cutting, wear or metallic debris
Important for wear, scoring, valve sticking and possible electrical concerns
Non-metallic or non-shiny particles
Polymer, rubber, mineral, oxide-coated material or residue
Helps separate metallic debris from other process or handling contamination
Fibres
Packaging, wipes, clothing, handling or the production environment
Useful for tracing contamination from handling or packaging steps
SEM-EDX
Elemental composition of a particle
Helps distinguish iron, aluminium, stainless steel, glass, ceramic or mineral particles
FTIR
Organic or polymer-based material type
Useful for plastics, elastomers, oil, residue or organic contamination
Fibre classification should follow the applicable inspection specification. In the ALS example report, fibres are treated as non-metallic particles with a length-to-width ratio greater than 20, the maximum diameter ≤ 50 µm. Other standard editions or customer specifications may use different fibre measurement criteria.
Where the exact identity of a particle must be confirmed, SEM-EDX can provide elemental composition data. FTIR may also be used when the particle is organic or polymer-based. These methods are especially useful when particle analysis is used not only for cleanliness classification, but also for contamination source investigation.
How Particle Analysis Results Are Reported
Particle analysis results are usually reported as a cleanliness result showing particle count, particle size range and sometimes particle type. In many automotive cleanliness reports, this is expressed as a Component Cleanliness Code. The exact notation depends on the ISO 16232 edition, VDA 19.1 edition, OEM specification or customer reporting template.
A Component Cleanliness Code gives OEMs, suppliers and laboratories a shared way to communicate the particle profile of a component. The code groups particles into defined size ranges and assigns a cleanliness level for each range.
Example
CCC = A (B11/C9/D7/E6/F3/G0/H1/I00/J00/K00)
In this example, each letter represents a particle size range and each number indicates the count level found in that range. Lower numbers generally indicate fewer particles in that size class.
The exact notation, size classes and upper size ranges should always follow the applicable standard edition, OEM specification or customer reporting template. Some reports may use B to K notation, while other specifications or standard updates may use extended ranges. For this reason, the code should be treated as a reporting example rather than a universal format for every cleanliness inspection.
The measured cleanliness result is then compared against the customer requirement, drawing, purchase specification or internal quality limit. This gives the manufacturer a clearer basis for release, investigation, supplier qualification or corrective action.
Where Particle Analysis Matters Most
Particle analysis is most valuable for components where particulate contamination has a direct path to functional failure.
Application area
Typical risk
Why particle analysis helps
Hydraulic systems
Sticking valves, scoring, leakage or restricted flow
Checks particles in narrow passages and precision clearances
Fuel injection systems
Nozzle damage, spray disruption or flow concern
Detects oversized or hard particles before assembly
Transmission and lubrication components
Wear in oil passages, bearings or moving interfaces
Supports process control and supplier qualification
Cooling and thermal management components
Flow restriction, sealing issue or thermal transfer concern
Useful for EV and high-precision cooling circuits
Power electronics and electronic assemblies
Insulation risk, bridging or process contamination
Particle type can matter as much as particle size
Particle analysis is also useful during supplier qualification, process validation, field failure investigation and production change control. If a machining process, washing process, packaging material or assembly step changes, particle analysis can help confirm whether the change has affected cleanliness.
Frequently Asked Questions
What is the difference between particle analysis and visual cleanliness inspection
A visual cleanliness inspection can identify visible contamination, but it cannot measure particle count, size distribution, mass or material composition with the same level of detail. Particle analysis is a controlled laboratory process that produces quantitative cleanliness data for OEM review, supplier quality requirements and process investigation.
Can particle analysis identify the source of contamination
Particle analysis can provide strong evidence about possible contamination sources. Metallic shiny particles may point to machining or wear. Fibres may point to packaging, wiping materials, clothing or handling. SEM-EDX and FTIR can provide more detailed material information. Definitive source attribution may still require a broader failure analysis or process investigation.
Do all automotive components require particle analysis
No. Particle analysis is applied selectively to components where particulate contamination creates a defined functional or quality risk. This often includes components with narrow fluid channels, precision clearances, sealing surfaces, hydraulic passages, fuel pathways, cooling circuits or sensitive electronic areas. If an OEM drawing or customer specification defines a cleanliness requirement, particle analysis may be needed to verify compliance.
Is particle analysis always covered by ISO/IEC 17025 accreditation
Not necessarily. ISO/IEC 17025 accreditation applies to specific methods within a laboratory’s accredited scope. Some parts of the workflow may be accredited, while additional particle classification, SEM-EDX, FTIR or source investigation may be reported as supporting analysis depending on the laboratory scope and customer requirement. For formal submissions, the applicable scope should be confirmed before testing.
Request a Particle Analysis Quote
Whether you are establishing a cleanliness testing programme for a new component, investigating contamination from a production process, or qualifying a supplier against an OEM cleanliness requirement, ALS Testing can support particle analysis for automotive components.
What to prepare before submitting samples
Applicable standard or customer specification
Cleanliness limit or required Component Cleanliness Code
Component drawing and material information
Critical surfaces or internal channels to be assessed
Sample quantity and production condition
Packaging condition and handling requirements
OEM report template where applicable
Testing under ISO/IEC 17025 accreditation is available where covered by the applicable accredited scope. Additional particle identification support such as SEM-EDX or FTIR can be included where required by the customer specification or investigation objective.
Next Steps
See our full Technical Cleanliness Testing services for automotive components at https://www.alstesting.co.th/technical-cleanliness-testing/
Read our companion guide comparing the two governing standards ISO 16232 vs VDA 19
For a deeper look at particle size distribution and cleanliness classification, see our explainer on Particle Size Analysis
Contact our team for a particle analysis quotation or technical discussion at https://www.alstesting.co.th/contact-us/
ISO/IEC 17025 Accredited Testing Where Applicable | Extraction, Microscopic Counting and Particle Identification Support | Automotive Cleanliness Testing
Read moreJune 30, 2026
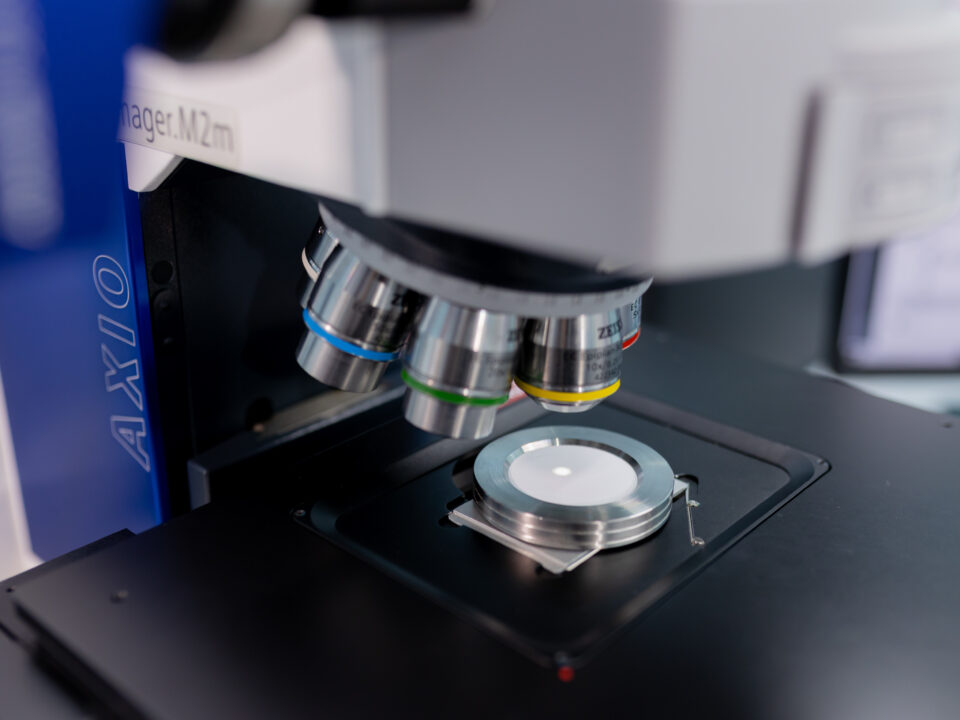
SEM · EDX · FTIR · Cross-Sectioning · Root Cause Investigation
ISO/IEC 17025 Accredited Testing Where Applicable | SEM EDX FTIR Cross-Section Support | Automotive Failure Analysis
A component can fail in many ways. It may crack during qualification testing, return from the field with corrosion, show a coating defect, or fail electrically without an obvious surface mark. The first question is usually what failed. The more useful question is why it failed.
Scanning electron microscopy analysis is one of the key techniques used in automotive failure investigation because it can examine fracture surfaces, corrosion features, particles, coatings and surface defects at much higher magnification than optical microscopy. It is rarely used alone. A stronger investigation usually combines SEM with EDX, FTIR, cross-sectioning and background information from the component’s service or production history.
A good failure analysis does not jump straight to the highest magnification. It starts with the least destructive checks, builds evidence step by step, and only cuts or alters the sample when the investigation has a clear reason to do so.
What Happens During Failure Analysis
Failure analysis is a structured investigation used to understand the physical, chemical or mechanical evidence behind a component failure. The aim is not simply to take microscope images. The aim is to connect the observed damage with the most likely failure mechanism and the conditions that caused it.
A typical investigation moves from broad observation to targeted analysis.
Stage
What it does
Why it matters
Visual and optical examination
Documents the sample as received and locates the failure area
Preserves evidence before cutting, cleaning or coating
SEM imaging
Examines fracture surfaces, corrosion, particles or surface defects at high magnification
Shows fine surface features that optical microscopy may miss
EDX analysis
Detects elemental signals from selected areas or particles
Supports material, contamination or corrosion hypotheses
FTIR spectroscopy
Identifies organic materials such as polymers, oils, coatings or residues
Useful for non-metallic contamination and polymer-related failures
Cross-sectioning
Cuts and polishes the sample to reveal internal structure
Shows coating layers, interfaces, crack paths, porosity or solder joint features
The order can change depending on the sample, but the principle is the same. Non-destructive documentation should come first. Destructive preparation should come later, once the analyst knows what evidence needs to be exposed.
Visual and Optical Examination
The first stage is simple but important. The laboratory documents the sample condition, photographs the failure area and records visible features such as cracks, corrosion, staining, deformation, wear marks or coating damage.
Stereo microscopy gives a low magnification overview with depth of field. This helps the analyst decide where to examine next with SEM or where a cross-section should be taken. Skipping this stage can remove context that may be needed later, especially if the sample is cut, cleaned or mounted.
Scanning Electron Microscopy Analysis
SEM uses a focused electron beam to scan the sample surface and create high magnification images. In failure analysis, this is especially useful for fracture surfaces and rough three-dimensional features.
On a broken metal part, SEM may show features that support a fatigue, overload, brittle fracture or wear-related interpretation. Fatigue striations, where present, can indicate progressive crack growth. Dimpled features may support ductile overload. Cleavage-like facets may support brittle fracture. These features are not interpreted in isolation; they must be considered with material, loading history, geometry and service conditions.
SEM is also useful for corrosion deposits, coating defects, particles, contamination and surface damage. It can show morphology clearly, but it does not identify every chemical compound by itself. That is why SEM is often paired with EDX.
What EDX Adds to SEM
EDX, also written as EDS, detects characteristic X-rays emitted from the sample when it is examined under the electron beam. This allows the analyst to identify elements present in a selected point, area or particle.
For example, EDX may detect chlorine, sulfur, oxygen, iron, aluminium, copper, silicon or other elemental signals. These signals can support a corrosion, contamination or material transfer hypothesis. However, EDX should not be described as confirming a specific compound on its own. Detecting chlorine does not automatically prove a defined chloride compound, and detecting sulfur does not automatically prove sulfate. The result needs to be interpreted with the sample condition, morphology and any supporting tests.
FTIR for Organic Materials and Residues
SEM and EDX are strong tools for imaging and elemental analysis, but they are not the best choice for identifying organic materials. FTIR is used when the question involves polymers, coatings, adhesives, oils, elastomers or residue films.
FTIR measures how a material absorbs infrared light and produces a spectrum that can be compared with reference data. In automotive failure analysis, FTIR may help identify a seal material, a polymer contaminant, an adhesive residue, a coating film or degraded organic material found near the failure area.
Cross-Section Analysis
Some failures cannot be understood from the surface. Cross-section analysis is used when the investigation needs to see inside the material, coating, solder joint, plated layer or bonded interface.
The sample is mounted, cut, ground and polished to expose the area of interest. In metals, etching may be used to reveal microstructure. In coatings or electronics, the cross-section can show layer thickness, voids, cracks, delamination, porosity or interface defects.
Because cross-sectioning permanently changes the sample, it should be performed after visual and surface examination. The cut location should be chosen based on the evidence already collected.
Which Technique Fits Which Failure
Different failure symptoms need different evidence. The table below gives a practical starting point, but the final test plan should be based on the sample condition and investigation objective.
Failure symptom
Useful techniques
Evidence the laboratory may look for
Cracked metal component
Visual exam, SEM, EDX, cross-sectioning
Crack origin, fracture mode, inclusions, corrosion or overload features
Corroded connector
Visual exam, SEM, EDX, FTIR where residue is present
Corrosion morphology, elemental signals, residue or film identification
Coating defect
Optical exam, cross-sectioning, SEM, FTIR
Coating thickness, adhesion issue, contamination, interface condition
Polymer or rubber failure
FTIR, optical exam, SEM where needed
Material identification, degradation, contamination or surface damage
Unknown particles or residue
SEM-EDX, FTIR
Elemental profile, organic material type or possible contamination source
A single technique may answer part of the issue, but most root cause work needs multiple evidence streams. SEM can show how a surface failed. EDX can add elemental information. FTIR can identify organic residue. Cross-sectioning can show what happened below the surface.
Example Investigation
Consider an automotive connector returned from the field after intermittent electrical failure. Visual examination may show staining around the contact area. SEM can examine the contact surface at higher magnification and show corrosion morphology or particles between contacts. EDX can detect elemental signals such as chlorine, sulfur, copper, tin or other elements that support a contamination or corrosion hypothesis.
If a film or residue is present, FTIR may help identify whether it is an oil, polymer, adhesive residue or process-related organic material. If moisture ingress or seal failure is suspected, a cross-section through the sealing area can show whether the interface, seal geometry or housing condition contributed to the failure.
The conclusion should be based on all of the evidence, not on one image or one spectrum alone.
What to Prepare Before Sending a Sample
Failure analysis is more focused when the laboratory receives both the failed part and the right background information. Prepare the following where available.
Component name and function
Failure symptom and when it was discovered
Whether the sample came from production, qualification testing or the field
Material grade, coating, plating or surface treatment
Operating environment such as heat, humidity, vibration or chemical exposure
Number of failed samples and number of good comparison samples
Photos before removal or cleaning, if available
Any previous test data or inspection records
What decision the report needs to support, such as root cause, corrective action or customer response
Avoid cleaning, cutting or altering the failed area before submission unless the laboratory advises it. If comparison samples are available, include them. A good part from the same lot can make the investigation much stronger.
What a Failure Analysis Report Can and Cannot Do
A failure analysis report can identify observed damage, describe the evidence, explain the likely failure mechanism and support an evidence-based root cause conclusion. In many cases, it can also suggest contributing factors or recommend what process area should be checked next.
It should not be treated as a legal judgement by itself. Whether the root cause becomes supplier responsibility, design issue, production escape, misuse or field exposure depends on technical evidence plus contractual and commercial context.
Turnaround time also depends on scope. A simple SEM-EDX examination may be faster than a multi-technique investigation involving cross-section preparation, FTIR and comparison samples. If the case is urgent, the timing should be discussed before the test plan is confirmed.
Frequently Asked Questions
Do I need to know which technique I need before contacting a laboratory
No. You can send the failure description, photos and available background information first. The laboratory can recommend whether SEM, EDX, FTIR, cross-sectioning or another method is appropriate.
What is scanning electron microscopy analysis used for
Scanning electron microscopy analysis is used to examine fine surface features such as fracture morphology, corrosion deposits, wear marks, particles, coating defects and contamination. It helps show details that are not visible with normal optical microscopy.
Can SEM and EDX identify the exact cause of corrosion
They can support a corrosion investigation by showing morphology and elemental signals. They may indicate the presence of elements such as chlorine, sulfur or oxygen. The exact cause still depends on supporting evidence such as service history, material condition, environment, residue analysis and process data.
Is failure analysis only for metal components
No. Failure analysis can be applied to metals, polymers, rubber, coatings, adhesives, electronics materials and composites. The technique selection depends on the material and the failure symptom.
Is every failure analysis result covered by ISO/IEC 17025 accreditation
Not necessarily. ISO/IEC 17025 accreditation applies to specific methods within a laboratory’s accredited scope. If accredited results are required for submission, confirm the exact method and scope before testing begins.
Go Deeper into SEM Analysis
This article explains SEM as part of a broader failure analysis workflow. For a more detailed technical guide to SEM imaging, magnification, sample preparation and limitations, read the dedicated SEM Analysis for Automotive Failure Investigation article.
Request a Failure Analysis Quote
ALS Testing can support automotive failure analysis for cracked components, corrosion, coating defects, contamination, polymer issues and field-returned assemblies.
Testing under ISO/IEC 17025 accreditation is available where covered by the applicable accredited scope. Share the sample condition, failure background and required report purpose so the laboratory can recommend the right investigation plan.
Next Steps
Back to Failure Analysis Hub for the full service overview at https://www.alstesting.co.th/failure-analysis-services-sem-ftir-edx-als-testing/
Read the detailed SEM Analysis guide for automotive failure investigation
Explore FTIR material identification capabilities for automotive materials
Contact our team to discuss a failure analysis investigation at https://www.alstesting.co.th/contact-us/
ISO/IEC 17025 Accredited Testing Where Applicable | SEM EDX FTIR Cross-Section Support | Automotive Failure Analysis
Read moreJune 30, 2026
Cleanliness · Failure Analysis · Materials and Environmental · Chemical and Electronics
ISO/IEC 17025 Accredited Testing Where Applicable | Cross Discipline Testing Support | Automotive Specialist
Automotive testing standards help manufacturers prove that a component meets the requirement written in an OEM drawing, material specification, purchase document or quality agreement. The challenge is that automotive testing does not rely on one standard family. Cleanliness, corrosion, VOC emissions, humidity, PCB contamination and chemical compliance may each use different ISO, VDA, IEC, ASTM, IPC or regulatory references.
This guide brings the key automotive testing standards together by discipline, so engineering, quality and procurement teams can identify what each reference is used for and what information should be confirmed before sending samples to a laboratory.
How to Use This Guide
The standard named in the customer document should always be treated as the controlling requirement. If the drawing says ISO 9227, test to ISO 9227. If it says ASTM B117, test and report against ASTM B117. If it references an OEM method or a specific revision, send that document to the laboratory before testing starts.
For quick screening, use the table below to match the testing need with the standard family.
Testing need
Common standards or methods
What to confirm before testing
Technical cleanliness and particles
ISO 16232, VDA 19.1, VDA 19.2
Component surfaces, extraction method, cleanliness code and report format
Failure investigation
SEM, EDX, FTIR, microscopy, cross-sectioning
Failure mode, sample history, suspected material or process issue
Corrosion and environmental exposure
ISO 9227, ASTM B117, IEC 60068 series
Exposure condition, duration, inspection interval and acceptance criteria
Interior material emissions
VDA 278, ISO 12219, VDA 275, ISO 6452
Material type, OEM requirement, VOC or fogging criterion
Electronics and chemical testing
IPC-TM-650, J-STD-001, IEC 62321, REACH
Board type, target substances, acceptance limit and required report scope
Cleanliness and Particle Contamination Standards
Technical cleanliness testing measures particulate contamination on functionally relevant automotive components. It is often used for parts with narrow channels, sealing surfaces, fluid passages or precision clearances.
ISO 16232 specifies requirements for applying and documenting methods used to determine particulate contamination on functionally relevant components and systems of road vehicles. It is commonly used in global automotive supply chains.
VDA 19.1 is the German automotive guideline for inspection of technical cleanliness and particulate contamination on functionally relevant components. VDA 19.2 focuses on technical cleanliness in assembly environments, including the conditions that help prevent new contamination from being introduced during production.
ISO 16232 and VDA 19.1 are closely aligned for many component cleanliness applications, but the required reporting format, cleanliness class notation or customer template may still differ. The laboratory should follow the standard and format named in the customer requirement.
For detailed guidance, link this section to the ISO 16232 vs VDA 19 guide and the Particle Analysis in Automotive Manufacturing article.
Failure Analysis Techniques
Failure analysis usually does not start with one governing automotive test standard. It starts with a problem, such as fracture, corrosion, leakage, delamination, contamination, coating failure or unexpected wear. The laboratory then selects the techniques needed to build evidence around the failure mechanism.
SEM provides high magnification imaging of fracture surfaces, corrosion sites and contamination features. EDX adds elemental composition data from selected points or areas. FTIR can identify organic materials such as polymers, oils, coatings and residues. Cross-sectioning exposes internal structure, coating layers, solder joints, cracks or interfaces for closer examination.
These methods may be performed under accredited or validated laboratory procedures where covered by scope. If the report will be used for customer submission, legal review or supplier dispute, the required method, scope and reporting format should be confirmed before testing begins.
Materials and Environmental Testing Standards
Materials and environmental testing checks how automotive parts respond to heat, humidity, corrosion, emissions and other service related exposure conditions.
VDA 278 is used for thermal desorption analysis of VOC and FOG emissions from automotive interior materials. ISO 12219 covers vehicle interior air and component level VOC measurement methods. VDA 275 is used for formaldehyde emission testing of interior materials. ISO 6452 assesses fogging behaviour of interior trim materials that may deposit condensable films on glass surfaces.
ISO 9227 defines salt spray test atmospheres including neutral salt spray, acetic acid salt spray and copper accelerated acetic acid salt spray. ASTM B117 is a salt spray or salt fog practice commonly referenced in ASTM based or North American specifications and is broadly comparable to the neutral salt spray atmosphere in ISO 9227.
The IEC 60068 series is used for environmental testing of electrotechnical products and components. IEC 60068-2-14 covers change of temperature testing. IEC 60068-2-1 covers cold testing. IEC 60068-2-2 covers dry heat testing. IEC 60068-2-78 covers damp heat steady state testing. The exact severity, duration and acceptance criteria should come from the product or customer specification.
Chemical and Electronics Standards
Chemical and electronics testing covers ionic contamination, soldering cleanliness evidence, restricted substances and material compliance.
IPC-TM-650 2.3.28 is an ion chromatography method for ionic analysis of circuit boards. It can be used to identify and quantify specific anions and cations extracted from printed boards or assemblies.
J-STD-001 is an assembly requirement standard for soldered electrical and electronic assemblies. It should not be described as a universal requirement for ion chromatography on every PCB. Cleanliness compliance may be supported by objective evidence, qualified process data, SIR testing, ionic process monitoring, IC analysis or customer specific requirements.
IEC 62321 is the method series used to determine certain restricted substances in electrotechnical products for RoHS related assessment. REACH SVHC screening is a regulatory compliance activity based on substances of very high concern identified under REACH. The analytical method depends on the substance category and the required reporting scope.
Master Standards Reference
Use this table as the main reference map. It separates formal standards, regulatory references and analytical techniques so they are not treated as the same type of requirement.
Reference
Discipline
What it covers
ISO 16232
Cleanliness
Particulate contamination inspection for functionally relevant road vehicle components and systems
VDA 19.1
Cleanliness
Technical cleanliness inspection for particulate contamination in automotive components
VDA 19.2
Cleanliness
Technical cleanliness control in assembly environments
SEM, EDX, FTIR and cross-sectioning
Failure analysis
Analytical techniques used for root cause investigation, material identification and failure evidence
VDA 278
Materials and environmental
VOC and FOG thermal desorption analysis for automotive interior materials
ISO 12219
Materials and environmental
VOC measurement for vehicle interior air and interior materials
VDA 275
Materials and environmental
Formaldehyde emission testing for automotive interior materials
ISO 6452
Materials and environmental
Fogging behaviour of interior trim materials
ISO 9227
Materials and environmental
Salt spray corrosion testing including NSS, AASS and CASS atmospheres
ASTM B117
Materials and environmental
Salt spray or salt fog apparatus practice, commonly used for neutral salt spray testing
IEC 60068-2-14
Materials and environmental
Change of temperature testing
IEC 60068-2-1
Materials and environmental
Cold testing
IEC 60068-2-2
Materials and environmental
Dry heat testing
IEC 60068-2-78
Materials and environmental
Damp heat steady state testing
IPC-TM-650 2.3.28
Chemical and electronics
Ionic analysis of circuit boards by ion chromatography
J-STD-001
Chemical and electronics
Soldered assembly requirements and cleanliness evidence framework
IEC 62321 series
Chemical and electronics
Determination of certain restricted substances in electrotechnical products
REACH SVHC
Chemical and electronics
Screening or assessment for substances of very high concern under REACH
How Accreditation Supports Testing
ISO/IEC 17025 accreditation provides independent recognition that a laboratory is competent to perform specific testing or calibration activities within its accredited scope. It does not automatically mean every method, standard, technique or investigation type listed in a guide is covered.
For formal submissions, supplier qualification or OEM review, confirm three things before testing starts.
The required standard and revision
Whether the method is covered by the laboratory’s accredited scope
The report format or customer template required for submission
ILAC MRA recognition can support international acceptance of accredited results between accreditation bodies and markets, but customer acceptance still depends on the specification, contract requirement and scope of accreditation.
Choosing the Right Standard
The easiest way to avoid retesting is to start from the source document rather than from a general service name. A request that says “automotive testing” or “environmental test” is usually not enough.
What you have
What it usually tells the laboratory
What may still be missing
OEM drawing
Standard name, acceptance criteria and sometimes sample condition
Revision, test duration or report template
Material specification
Required test method and performance limit
Sample preparation or inspection intervals
Purchase or quality agreement
Required compliance evidence
Exact method variant or accreditation requirement
Internal issue report
Failure symptom and suspected cause
Correct analytical method and comparison baseline
No standard named
General testing need only
Laboratory must help define a suitable test plan before quotation
If the standard is unclear, send the full document title, revision, part number, material information, sample quantity and intended use of the report. This helps the laboratory confirm whether the work should be run under cleanliness testing, failure analysis, environmental testing, corrosion testing or chemical and electronics testing.
Frequently Asked Questions
How do I know which automotive testing standard applies
Start with the OEM drawing, material specification, purchase document or quality agreement. That document should name the standard, revision, test condition and acceptance criteria. If it does not, send the document to the laboratory for review before submitting samples.
Are ISO and VDA standards interchangeable
Not always. Some ISO and VDA methods are closely aligned, such as ISO 16232 and VDA 19.1 for technical cleanliness, but report format, notation and customer templates may differ. The report should follow the requirement named by the customer.
Is failure analysis covered by one automotive standard
Usually no. Failure analysis is a structured investigation using techniques such as SEM, EDX, FTIR, microscopy and cross-sectioning. The method depends on the failure mode and the evidence needed.
Does accreditation cover every standard in this guide
No. ISO/IEC 17025 accreditation applies to specific methods within the laboratory’s scope. If accredited results are required, confirm the exact method and scope before testing begins.
What should I send before asking for a quote
Send the standard name, revision, drawing or specification, sample description, material information, required acceptance criteria, report format and whether accredited results are required.
Explore ALS Testing Services by Discipline
ALS Testing supports automotive testing across cleanliness, failure analysis, materials and environmental testing, and chemical and electronics testing for manufacturers, suppliers and engineering teams in Malaysia and Southeast Asia.
Testing under ISO/IEC 17025 accreditation is available where covered by the applicable accredited scope. For standards or OEM methods not listed here, share the full requirement so ALS can confirm capability before samples are submitted.
Next Steps
Back to Automotive Testing Hub for the full service overview at https://www.alstesting.co.th/automotive-testing-services-als-testing-laboratory/
Technical Cleanliness Testing at https://www.alstesting.co.th/technical-cleanliness-testing/
Failure Analysis Services at https://www.alstesting.co.th/failure-analysis-services-sem-ftir-edx-als-testing/
Materials and Environmental Testing at https://www.alstesting.co.th/automotive-materials-environmental-testing-als-testing/
Chemical and Electronics Testing at /chemical-electronics-testing/
Review laboratory accreditation scope at /accreditations/
Contact our team for guidance on which standard applies to your component at https://www.alstesting.co.th/contact-us/
ISO/IEC 17025 Accredited Testing Where Applicable | Cross Discipline Automotive Testing Support | Standards Based Reporting
Read moreJune 30, 2026
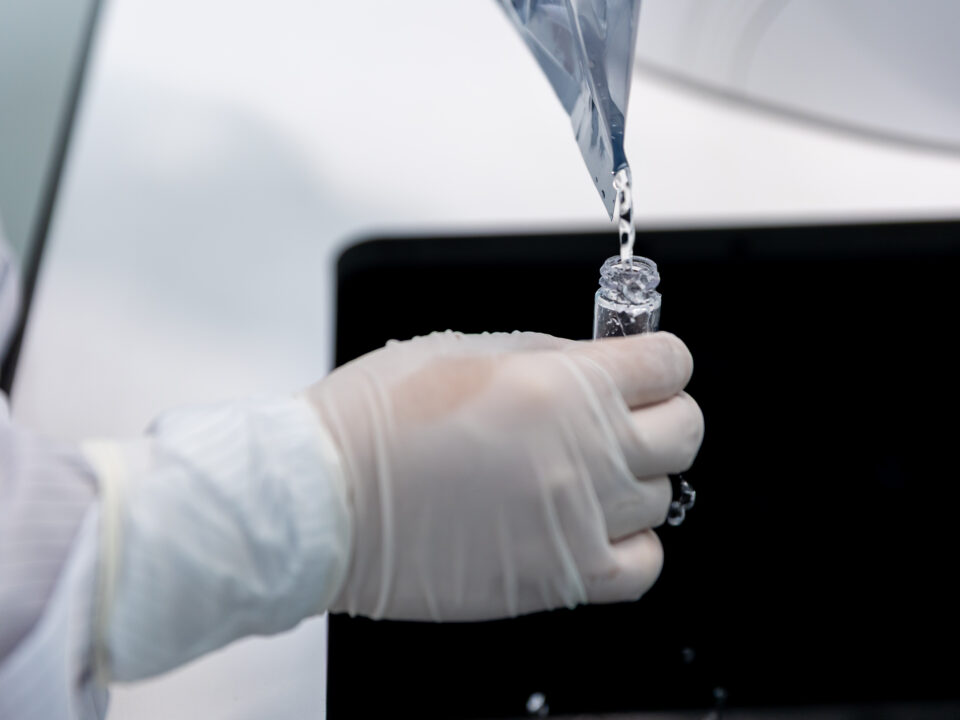
Ion Chromatography · ROSE Screening · IPC-TM-650 2.3.28 · J-STD-001 Cleanliness Evidence
ISO/IEC 17025 Accredited Testing Where Applicable | Anion and Cation Analysis | Electronics Testing Support
A printed circuit board can pass functional testing at the end of production and still fail later in the field. One reason is residual ionic contamination left after soldering, cleaning or handling. These residues may not be visible, but under humidity and voltage bias they can support corrosion, leakage current or electrochemical migration.
A PCB test for ionic contamination helps manufacturers check whether residues on a board or assembly are within the cleanliness requirement defined by a customer, OEM or internal process control plan. For automotive electronics, this matters because control units, sensors, battery management systems and power electronics often operate under heat, vibration and humidity for long service periods.
In practical terms, PCB cleanliness testing does two things. It measures whether ionic residues are present, and it helps identify which ionic species are involved. That distinction is important because a total contamination number alone may not explain the source or risk of the residue.
Why PCB Cleanliness Matters
Ionic residues can come from flux activators, soldering chemistry, cleaning process variation, handling, packaging or the production environment. If these residues remain on the board, they may become active when moisture and electrical bias are present.
Risk area
What may happen
Why it matters in automotive electronics
Corrosion
Conductors, solder joints or contacts may corrode
Can reduce long term reliability of assemblies exposed to humidity
Electrochemical migration
Dendritic growth may form between biased conductors
Can create intermittent shorts or leakage paths
Leakage current
Residues may allow unwanted current flow
Can affect sensitive circuits and signal stability
Process variation
Residue levels may change between production lots
Helps identify cleaning, flux or handling issues before field failures
PCB cleanliness testing is therefore not only a pass or fail check. It is also a process control and root cause tool, especially when a supplier needs to prove that a soldering and cleaning process is stable.
ROSE Testing and Ion Chromatography
ROSE testing, also known as Resistivity of Solvent Extract testing, has long been used as a fast screening method for ionic contamination. It extracts ionisable residues into a solvent and measures the conductivity or resistivity change of that solution.
ROSE is useful for routine monitoring, but it reports contamination as an overall value. It does not identify whether the residue is chloride, sulfate, nitrate, acetate, formate, sodium, potassium, ammonium or another ionic species.
Ion chromatography gives more detail. It separates and measures individual ionic species in the extract. This makes IC more useful when the goal is root cause investigation, customer submission or a detailed cleanliness profile.
Method
What it shows
Best use
Limitation
ROSE testing
Overall ionic contamination response
Fast production screening and process monitoring
Does not identify individual species
Ion chromatography
Specific anions and cations in the extract
Detailed cleanliness profile, root cause work and customer evidence
Requires laboratory analysis and clear extraction conditions
SIR testing
Electrical insulation behaviour under humidity and bias
Process qualification and reliability evidence
Longer test duration and different purpose from IC
ROSE and IC should not be treated as interchangeable. ROSE can indicate that a process may need attention. IC can show which residues are present and help guide corrective action.
IPC Methods and Cleanliness Evidence
IPC-TM-650 2.3.28 is the IPC test method commonly associated with ionic analysis of circuit boards by ion chromatography. It is used to measure extractable ionic contamination from printed boards or printed board assemblies and report specific ions in the extract.
J-STD-001 is different. It is an assembly requirement standard for soldered electrical and electronic assemblies. It does not mean every PCB assembly must automatically be tested by IC. Cleanliness compliance depends on the class, product requirement, user agreement and objective evidence supporting the manufacturing process.
Reference
Role in PCB cleanliness testing
Practical point
IPC-TM-650 2.3.28
Ion chromatography method for extractable ionic contamination
Used when species level ionic data is required
J-STD-001
Assembly requirements including cleaning and residue expectations
Supports process qualification and objective evidence rather than one universal IC limit
Customer or OEM specification
Defines acceptance criteria, sample type, method and reporting format
Should be treated as the controlling requirement for submission
SIR or other reliability evidence
Shows electrical reliability under defined conditions
Often used alongside chemical cleanliness evidence for process validation
A key point is that there is no single universal pass or fail limit that applies to every PCB, assembly class and automotive application. The older 1.56 µg NaCl equivalent per cm² value should not be used as a blanket acceptance criterion for all modern PCB cleanliness work. Limits should come from the customer specification, OEM requirement, qualified process data or agreed objective evidence.
What Ion Chromatography Can Identify
Ion chromatography can measure anions such as chloride, fluoride, sulfate, nitrate, phosphate and organic acid residues such as acetate or formate, depending on the method and scope. It can also be used for cations such as sodium, potassium, ammonium and related ionic species where the test programme includes cation analysis.
The value of this species level result is practical. Elevated chloride may point toward corrosive residues or environmental chloride exposure. Organic acid residues may relate to flux chemistry or incomplete process control. Sodium or potassium may suggest handling, cleaning chemistry or environmental sources.
The report should not be read in isolation. A high ion result may indicate a contamination concern, but root cause depends on the board design, process history, flux system, cleaning process, storage condition and failure evidence.
Reading a PCB Cleanliness Report
A useful PCB cleanliness report should state the test method, extraction condition, sample area, board or assembly description, ions measured, result units and any customer limit used for comparison.
For IC, results are commonly reported by species, often as mass per unit area. The most useful part of the report is not only whether a limit is exceeded, but which ions dominate the result. That information can help the manufacturer decide whether to review flux residue, wash process, rinsing quality, handling, packaging or environmental exposure.
If the test is being used for formal submission, the report format should follow the customer or OEM requirement. If the test is being used for troubleshooting, the report should be interpreted together with production history and any visual or failure analysis evidence.
When to Pair PCB Cleanliness Testing with Failure Analysis
PCB cleanliness testing is useful for production monitoring and qualification, but field failures often need more than chemistry data. If a returned assembly shows corrosion, dendritic growth, leakage current or intermittent failure, IC can confirm whether ionic residues are present and identify the species involved.
Failure analysis can then examine the affected area directly. SEM-EDX may help characterise corrosion products or elemental composition at a failure site. Cross-sectioning or microscopy may show whether corrosion is linked to a solder joint, conductor spacing, coating defect or trapped residue under a component.
Used together, IC and failure analysis provide stronger evidence than either method alone.
Before Submitting Samples
Before sending a PCB or assembly for cleanliness testing, confirm the purpose of the test. A production screening request, an OEM qualification submission and a field failure investigation may need different sample handling and reporting.
Prepare the following information where available.
Board or assembly type
Customer or OEM specification
Required IPC method or internal method
Required ions, such as anions only or anions and cations
Acceptance criteria or objective evidence requirement
Board area or extraction area
Flux type and cleaning process
Production lot or failure background
Packaging and handling condition
Required report format
Samples should be handled in a way that avoids adding new contamination before testing. Packaging, gloves, storage and transport conditions can affect the result, especially when the residues of interest are present at low levels.
Frequently Asked Questions
Is ion chromatography always better than ROSE testing
Not always. IC provides more detailed information because it identifies individual ionic species. ROSE is still useful as a faster screening or process monitoring method. IC is more suitable when root cause evidence, species level data or customer submission detail is required.
What ionic species are most concerning on PCB assemblies
Chloride is often treated as a key concern because it can support corrosion at low levels under the right conditions. Sulfate, nitrate, organic acids, sodium, potassium, ammonium and amine related residues may also matter depending on the design, environment and customer specification.
Does J-STD-001 require ion chromatography for every PCB
No. J-STD-001 cleanliness requirements are tied to qualified manufacturing process and objective evidence. IC may be used as part of that evidence, but it is not automatically required for every PCB in every situation.
Is 1.56 µg NaCl equivalent per cm² still a universal pass fail limit
No. It should not be used as a universal cleanliness limit for all PCB assemblies. Modern cleanliness assessment should follow the customer requirement, product class, qualified process data and agreed objective evidence.
Does PCB cleanliness testing also cover RoHS or REACH
No. Ionic contamination testing and RoHS or REACH compliance are different test programmes. PCB cleanliness testing looks at ionic residues that may affect electrical reliability. RoHS and REACH relate to restricted substances and chemical compliance.
Request a PCB Cleanliness Testing Quote
ALS Testing can support PCB cleanliness testing for production checks, process qualification, customer submission and field failure investigation.
Testing under ISO/IEC 17025 accreditation is available where covered by the applicable accredited scope. If accredited results are required, confirm the exact method, ions, sample type and reporting requirement before testing begins.
What to prepare before requesting a quote
PCB or assembly description
Required method or customer specification
Required ion list
Sample quantity and board area
Acceptance limit or objective evidence requirement
Flux and cleaning process information
Failure background if applicable
Required report format or OEM template
Providing these details early helps the laboratory confirm the right extraction approach, analysis scope, report format and turnaround time.
Next Steps
See our full Chemical and Electronics Testing services at /chemical-electronics-testing/
Read our guide on PCB failure investigation and root cause analysis at https://www.alstesting.co.th/failure-analysis-services-sem-ftir-edx-als-testing/
Explore Technical Cleanliness Testing services for components beyond electronics at https://www.alstesting.co.th/technical-cleanliness-testing/
Contact our team for a PCB cleanliness testing quotation or technical discussion at https://www.alstesting.co.th/contact-us/
ISO/IEC 17025 Accredited Testing Where Applicable | Ion Chromatography for PCB Cleanliness | Electronics Testing Support
Read moreJune 30, 2026
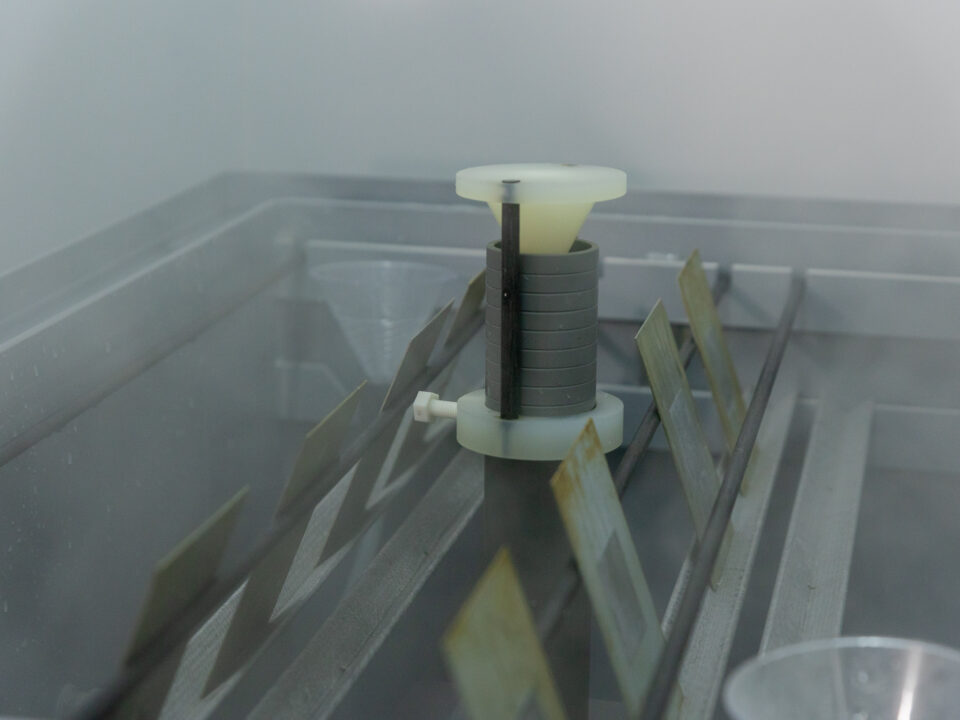
Neutral Salt Spray · Acetic Acid Salt Spray · Copper Accelerated Test · Cyclic Corrosion Testing
ISO/IEC 17025 Accredited Testing Where Applicable | Corrosion Testing Capability | Automotive Standard Testing
A vehicle’s underbody, fasteners, brackets, exterior fittings and coated metal parts are exposed to moisture, road salt, temperature changes and surface damage throughout service life. Manufacturers need a controlled way to evaluate whether a coating, plating or corrosion protection system meets the requirement stated in an OEM drawing or material specification.
Salt spray testing provides controlled corrosion exposure inside a test chamber. It should not be treated as a direct conversion from test hours to years of road use. The result is used for comparison, qualification and quality control against a defined standard, exposure duration and acceptance criterion.
For automotive parts, the most commonly referenced standards are ISO 9227 and ASTM B117. ASTM B117 is broadly comparable to the neutral salt spray atmosphere in ISO 9227, while ISO 9227 also includes AASS and CASS atmospheres for specific materials and coating systems.
What Salt Spray Testing Measures
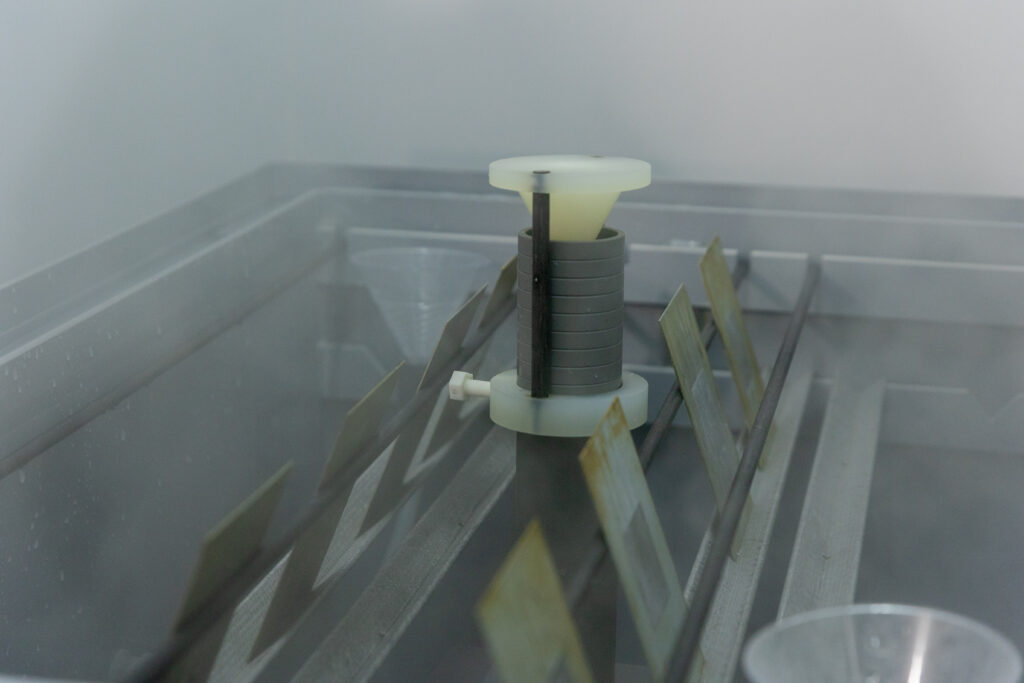
Salt spray testing, also called salt fog testing, exposes a specimen to an atomised salt solution in a controlled chamber. The test is used to assess how a material, coating, plating or corrosion protection system responds under a defined corrosive atmosphere.
For automotive components, the result is usually assessed through visual inspection after a defined exposure period. Depending on the specification, the report may evaluate white corrosion, red rust, blistering, corrosion creep from scribed areas, coating breakdown or another acceptance criterion.
What the test checks
Why it matters
Corrosion formation
Shows whether corrosion appears within the specified exposure period
Coating or plating performance
Helps assess whether surface protection meets the requirement
Corrosion creep from scribe
Used when the specification requires evaluation from a damaged coating line
White corrosion or red rust
Common acceptance criteria for plated or coated metallic parts
Visual rating or pass fail result
Supports supplier approval, production validation or OEM submission
Salt spray testing is useful because it is standardised and repeatable. Its main limitation is that it does not reproduce every real driving condition such as drying cycles, UV exposure, road debris, coating damage or climate variation.
ISO 9227 Test Atmospheres
ISO 9227 defines three main salt spray atmospheres. The correct atmosphere should come from the customer specification, not from general preference.
ISO 9227 atmosphere
Common name
Typical use
NSS
Neutral Salt Spray
General corrosion testing for metallic materials with or without corrosion protection
AASS
Acetic Acid Salt Spray
More aggressive testing for selected coatings, aluminium related applications and decorative plating systems where specified
CASS
Copper Accelerated Acetic Acid Salt Spray
Highly aggressive testing often used for decorative copper nickel chromium or nickel chromium coating systems where specified
NSS is the most common route for automotive coated or plated parts. AASS and CASS should only be selected when the product standard, OEM requirement or customer specification calls for those atmospheres.
ASTM B117 and ISO 9227 NSS
ASTM B117 is the American standard practice for operating salt spray or salt fog apparatus. In automotive supply chains, it is often referenced by North American drawings, material standards and customer requirements.
The key point is that ASTM B117 should be compared mainly with ISO 9227 NSS. It should not be treated as identical to ISO 9227 as a whole because ISO 9227 also includes AASS and CASS.
Dimension
ISO 9227
ASTM B117
Main scope
Salt spray testing with NSS, AASS and CASS
Salt spray or salt fog apparatus practice
Closest overlap
ISO 9227 NSS
ASTM B117 neutral salt fog
Additional atmospheres
AASS and CASS included
Not the main focus
Typical use
Global, European and Asian OEM specifications
North American and ASTM based specifications
Test duration
Set by product, OEM or customer specification
Set by product, OEM or customer specification
Acceptance criteria
Defined by the citing specification
Defined by the citing specification
A chamber capable of running one method may often support the other when properly validated, but the report must follow the exact standard named in the requirement.
Continuous Salt Spray and Cyclic Corrosion Testing
Continuous salt spray testing creates a constant salt fog environment. It is repeatable, but it does not represent every condition that a vehicle experiences in service. Real exposure often includes wet periods, dry periods, humidity changes, temperature variation and surface damage.
Cyclic corrosion testing is used when the specification requires alternating phases instead of constant salt fog.
Test type
Exposure pattern
When it is used
Continuous salt spray
Constant salt fog exposure
When ISO 9227 NSS, AASS, CASS or ASTM B117 is specified
Cyclic corrosion testing
Alternating salt, humidity, drying and sometimes other stages
When an OEM protocol requires changing wet and dry exposure
OEM corrosion protocol
Defined by manufacturer standard
When the drawing references a specific automotive corrosion method
If the requirement names a cyclic corrosion method, it should not be replaced with continuous salt spray unless the customer approves the change.
How Long a Salt Spray Test Takes
Test duration is set by the product specification, customer requirement or OEM drawing. The laboratory should not assume one generic duration for every component.
Example duration
Common use case
Important note
24 to 96 hours
Basic screening or lower severity requirements
Use only when the specification allows it
240 hours
Moderate coating or plating requirements
Acceptance depends on the defined corrosion limit
500 hours
Higher durability or exterior related requirements
Does not equal a fixed number of service years
1,000 hours or more
Demanding corrosion resistance requirements
Requires advance scheduling and chamber planning
A component can pass a shorter exposure and still fail a longer one. This is why the required duration and acceptance criterion must be confirmed before testing starts.
Choosing the Right Salt Spray Test
The correct test method should always come from the drawing, material specification or customer requirement. A request that only says “salt spray test” is usually not enough.
Component or finish
Likely test route
What to confirm
Painted or coated steel parts
ISO 9227 NSS or ASTM B117
Exposure duration, scribe requirement and corrosion limit
Plated fasteners
ISO 9227 NSS or ASTM B117
White corrosion, red rust and coating specific criteria
Aluminium components
ISO 9227 NSS or AASS where specified
Material grade, coating type and atmosphere
Decorative plating systems
AASS or CASS where specified
Plating system and required severity
Exterior parts with wet dry exposure
Cyclic corrosion testing where specified
Exact OEM cycle and inspection points
Before testing, confirm the standard, atmosphere, duration, sample condition, inspection interval and pass fail criteria.
What the Result Tells You
A salt spray test result shows the condition of the specimen after exposure under a defined method. It may report corrosion products, coating blistering, corrosion creep, red rust, white corrosion or another visible change depending on the material and coating.
The result should be interpreted only against the acceptance criteria in the specification. It does not automatically prove long term field performance unless the customer has defined how the result should be used.
A complete report should state the standard used, test atmosphere, exposure duration, chamber conditions, sample description, inspection points and observed result.
Before Submitting Samples
Prepare these details before requesting a salt spray test.
Required standard such as ISO 9227, ASTM B117 or an OEM method
Required atmosphere such as NSS, AASS, CASS or cyclic corrosion
Exposure duration in hours or cycles
Acceptance criteria
Coating, plating or material specification
Drawing number and revision
Scribe, masking or orientation requirements
Sample quantity and dimensions
Interim inspection and photo requirements
Required report format or OEM template
If these details are missing, the laboratory may need to clarify the requirement before testing can begin.
Frequently Asked Questions
Is ISO 9227 the same as ASTM B117
Not exactly. ASTM B117 is broadly comparable to ISO 9227 NSS. ISO 9227 also includes AASS and CASS, so the two standards should not be treated as identical in every case.
Can salt spray test hours be converted into years of service life
No. Salt spray hours should not be converted directly into years of service life. Real vehicle exposure depends on climate, road salt use, humidity, temperature, coating damage, design and maintenance.
How do I know whether to use NSS, AASS or CASS
The required atmosphere should come from the customer or OEM specification. NSS is the most common neutral salt spray atmosphere. AASS and CASS are more aggressive and should be used only where specified.
What does a salt spray test result show
It shows how the tested specimen performed under a defined corrosive atmosphere for a defined exposure period. The result is compared against the acceptance criteria in the specification.
Can a component pass 96 hours but fail 500 hours
Yes. A coating or plating system can look acceptable after a shorter exposure and still show unacceptable corrosion after a longer exposure.
Request a Salt Spray Testing Quote
ALS Testing can support salt spray and corrosion testing for coated, plated and metallic automotive components where testing is required for qualification, supplier approval, process validation or customer submission.
Testing under ISO/IEC 17025 accreditation is available where covered by the applicable accredited scope. If accredited results are required for submission, confirm the exact method and scope before testing begins.
What to prepare before requesting a quote
Applicable standard or customer specification
Required test atmosphere
Required exposure duration
Component drawing and revision
Coating, plating or material specification
Sample quantity and dimensions
Scribe, masking or orientation requirements
Acceptance criteria
Interim inspection and photo requirements
Required report format or OEM template
Providing these details at the enquiry stage helps the laboratory confirm the correct method, chamber configuration, schedule and report format before the test begins.
Next Steps
See our full Materials and Environmental Testing services for automotive at https://www.alstesting.co.th/automotive-testing-services-als-testing-laboratory/
Read our detailed explainer on accelerated environmental ageing test methods
Back to Automotive Testing Hub for the full service overview at https://www.alstesting.co.th/automotive-testing-services-als-testing-laboratory/
Contact our team for a salt spray testing quotation or technical discussion at /contact/
ISO/IEC 17025 Accredited Testing Where Applicable | ISO 9227 and ASTM B117 Capability | Cyclic Corrosion Testing Available
Read moreJune 2, 2026
A PCB assembly passes visual inspection. Automated optical inspection finds nothing. Functional test at room temperature is clean. The board ships, gets installed in a vehicle, and three months later starts producing intermittent faults that are difficult to reproduce and expensive to trace.
The cause, when it is eventually found, is ionic contamination. Residual flux activator left on the board surface after soldering, invisible to optical methods and undetectable by functional test under dry conditions, has begun to drive electrochemical corrosion and leakage current in the presence of operating temperature cycling and humidity. The contamination was there from the start. The damage accumulated over time.
Anion and cation testing by ion chromatography is the analytical method that would have found it. This article explains how the test works, what it detects, why it matters specifically for automotive electronics, and how to interpret the results it produces.
What Is Ionic Contamination and Why Does It Matter?
Ionic contamination refers to charged chemical species, either positive ions (cations) or negative ions (anions), present on the surface of an electronic assembly or component. In the context of PCB manufacturing and assembly, ionic contamination originates primarily from flux residues left after soldering. All soldering fluxes contain activators, which are acidic or ionic compounds that break down the metal oxides on solder pads and component leads to allow good solder wetting. After soldering, these activators and their reaction products remain on the board surface as ionic residues.
Under dry conditions, ionic residues are typically benign. They sit on the surface, insoluble in dry air, causing no immediate problem. The failure mode is activated by moisture. When humidity rises or when condensation occurs on the board surface, ionic residues dissolve into a thin electrolytic film. That film becomes a conductive path between adjacent conductors. Current flows where it should not. In the presence of an applied voltage, the ionic species migrate: cations move toward the cathode and anions toward the anode, depositing metal at the cathode in a process called dendritic growth or electromigration. Dendrites are metallic crystalline growths that bridge the gap between conductors, causing intermittent or permanent short circuits.
The ionic species of greatest concern are those that are most mobile, most soluble, and most corrosive: chloride, fluoride, bromide, sulfate, acetate, and formate on the anion side; sodium, potassium, and ammonium on the cation side. Ammonium and organic amines from no-clean flux formulations are particularly significant because they indicate the presence of insufficiently activated or partially decomposed flux residues that retain moisture-absorbing and corrosion-promoting properties.
Ionic contamination is a latent failure mechanism. It is present from the moment of manufacture but causes damage only when activated by humidity and temperature. Testing before shipment is the only reliable way to detect it before it reaches field conditions.
How Ion Chromatography Works
Ion chromatography (IC) is an analytical technique that separates and quantifies ionic species in a liquid sample. The technique was developed in the 1970s and has become the standard method for trace ionic analysis across water quality, food safety, pharmaceutical, and electronics testing applications.
The operating principle is ion exchange chromatography. A liquid sample is injected onto a column packed with a charged stationary phase. Ionic species in the sample are attracted to and retained by the stationary phase, then released sequentially as the mobile phase gradient changes. Because different ions have different affinities for the stationary phase, they travel through the column at different speeds and emerge at the detector at different times, producing a chromatogram with a distinct peak for each ionic species.
Detection in modern IC systems uses a suppressed conductivity detector. As each ionic species elutes from the column, it passes through a suppressor device that converts the mobile phase background ions to low-conductivity water, leaving the analyte ions as the dominant conductivity signal. This suppression step dramatically improves sensitivity and selectivity, allowing detection of ionic species at concentrations of parts per billion (micrograms per litre) in solution, which translates to nanograms per square centimetre on a PCB surface.
Quantification is achieved by comparison with external calibration standards: solutions of known ionic concentration that are run alongside the samples and used to construct a calibration curve for each ionic species. The result for each ion is expressed as the measured concentration in the extract solution, which is then converted to surface density (typically micrograms per square centimetre) using the board surface area extracted.
Anion Analysis vs Cation Analysis
Anion and cation analysis require separate analytical conditions because anions and cations have opposite charges and require stationary phases and mobile phases of opposite polarity for effective separation. In practice, most IC instruments configured for anion analysis use an anion exchange column with a carbonate or hydroxide mobile phase, while cation analysis uses a cation exchange column with a dilute acid mobile phase.
The two analyses can be conducted sequentially on the same instrument platform or simultaneously on a dual-channel instrument. For a comprehensive ionic contamination assessment, both anion and cation analysis should be conducted from the same extraction solution, providing a complete profile of all ionic species present.
The Standard Method IPC-TM-650 2.3.28
The primary standard governing ionic contamination testing of PCBs and electronic assemblies by ion chromatography is IPC-TM-650 Method 2.3.28, published by IPC (the Association Connecting Electronics Industries). This method defines the extraction procedure, the IC analytical conditions, and the reporting requirements for ionic contamination testing.
The extraction procedure in IPC-TM-650 2.3.28 uses a mixture of 75 percent isopropyl alcohol and 25 percent deionised water (the IPA-water extract). The board or assembly is placed in a clean vessel and covered with a defined volume of the extraction solvent. The extraction is conducted for one hour at 80 degrees Celsius under agitation. The extract is then filtered and injected into the IC system for anion and cation analysis.
The extraction is designed to dissolve ionic species from the board surface into the solvent, including flux residues that are not fully soluble in water alone. The IPA component improves dissolution of organic flux residues while the water component provides the ionic medium for dissolution of inorganic ionic contaminants. The result is an extract that captures the full range of ionic species relevant to electronics reliability assessment.
Ionic Species
Ion Type
Primary Source on PCB
Failure Risk
Chloride (Cl-)
Anion
Flux activator residue, environmental deposition, halogenated materials
High – aggressive corrosion initiator, highly mobile
Fluoride (F-)
Anion
Some flux formulations, etching process residues
Moderate to high – corrosive to aluminium and some metals
Bromide (Br-)
Anion
Flame retardant materials, some flux systems
Moderate – corrosive at higher concentrations
Sulfate (SO4 2-)
Anion
Environmental deposition, some flux chemistry
Moderate – sulfate-induced corrosion
Nitrate (NO3-)
Anion
Environmental, some cleaning chemistry
Low to moderate – less corrosive than chloride
Acetate (CH3COO-)
Anion
No-clean flux activator decomposition products
Moderate – hygroscopic, promotes leakage current
Formate (HCOO-)
Anion
No-clean flux activator decomposition products
Moderate – indicates flux residue activity
Sodium (Na+)
Cation
Environmental, handling contamination, process water
Moderate – hygroscopic, promotes corrosion
Potassium (K+)
Cation
Environmental contamination
Moderate
Ammonium (NH4+)
Cation
No-clean flux amine activators, flux decomposition
High – hygroscopic, indicates active flux residues
Methylamine / TEA
Cation (amine)
No-clean flux amine-based activators
High – indicates incompletely deactivated flux
Chloride and ammonium are the two most diagnostically significant species in PCB ionic contamination testing. Elevated chloride indicates aggressive corrosion risk. Elevated ammonium or organic amines indicates the presence of active no-clean flux residues that retain corrosion-promoting properties.
Interpreting Anion and Cation Test Results
IC results for PCB ionic contamination are expressed as micrograms of each ionic species per square centimetre of board surface area. These surface density values are compared against the acceptance limits defined in the applicable cleanliness specification.
Acceptance Limits & Where Do the Numbers Come From?
Acceptance limits for ionic contamination in PCB assemblies originate from a combination of IPC standards, OEM-specific cleanliness specifications, and the results of reliability studies correlating ionic contamination levels with field failure rates. The most widely referenced historical limit is 1.56 micrograms sodium chloride equivalent per square centimetre, which was the original threshold defined for cleaned assemblies in earlier revisions of IPC standards.
Modern automotive electronics specifications typically apply tighter limits, particularly for chloride, which is often limited to 0.2 to 0.5 micrograms per square centimetre for safety-critical assemblies. The specific limit applicable to your assembly is defined by your customer’s specification, the relevant IPC document (IPC-7711, IPC-7721, or the cleanliness section of J-STD-001), or the OEM supplier quality requirement.
What High Chloride Tells You
Elevated chloride concentration is the most common and most diagnostically significant finding in PCB ionic contamination testing. The sources of chloride contamination on a PCB include residual flux activator (particularly from rosin and organic acid flux systems), environmental deposition of chloride aerosols in manufacturing or storage environments, and halogenated materials in the board laminate or component packaging that have been mobilised during processing.
When chloride is elevated above specification, the corrective action depends on identifying the source. If chloride tracks with the presence of specific component types or board regions near specific assembly operations, the source is likely process-related. If chloride is uniformly distributed across the board, environmental contamination during storage or handling is more likely. IC results alone identify that chloride is elevated; source investigation may require additional analytical steps including surface mapping by point extraction from specific board areas.
What Ammonium and Organic Amines Tell You
Ammonium and organic amine cations are characteristic markers of no-clean flux residue activity. Modern no-clean flux formulations use amine-based activators that are designed to fully decompose and become electrochemically inert during the soldering thermal profile. When ammonium or methylamine is detected at elevated levels in IC analysis, it indicates that the flux activator has not been fully deactivated, either because the soldering thermal profile was inadequate, the flux loading was excessive, or the specific flux chemistry is not compatible with the soldering process conditions.
This finding is significant because it means the residue retains hygroscopic and corrosion-promoting properties even though the board may have been manufactured under a no-clean process that is not expected to require cleaning. The corrective action is typically thermal profile optimisation, flux type review, or in some cases, a move to a cleaning process to remove the residue entirely.
Ion Chromatography vs ROSE Testing & Understanding the Difference
Ion chromatography is not the only method for assessing ionic contamination on PCBs. An older technique, ROSE testing (Resistivity of Solvent Extract), is still used in some applications and is worth understanding in the context of IC analysis.
ROSE testing measures the total ionic content of a board extract by its electrical conductivity, expressed as equivalent sodium chloride contamination in micrograms per square centimetre. It is a rapid, low-cost method that provides a single aggregate number representing all ionic contamination on the board. It does not identify which ionic species are present or in what proportions.
Ion chromatography supersedes ROSE testing in technical information value. IC identifies each ionic species individually, enabling diagnosis of the contamination source and targeted corrective action. ROSE testing tells you that contamination is present above a threshold. IC tells you what it is and, by inference, where it came from. For automotive electronics qualification, where the identity of contaminating species is increasingly required by OEM specifications and where root cause investigation of any failures is mandatory, IC is the appropriate method.
Dimension
ROSE Testing
Ion Chromatography (IC)
Output
Single conductivity number (NaCl equivalent)
Individual concentration of each anion and cation
Species identification
None
Full identification of all ionic species present
Sensitivity
Moderate
High – parts per billion detection in extract
Diagnostic value
Low – pass/fail only
High – identifies species and enables source tracing
OEM acceptance
Declining – many specs now require IC
Accepted by all major automotive OEM specifications
Standard reference
IPC-TM-650 2.3.25
IPC-TM-650 2.3.28
Cost
Lower
Higher – more information per test
Typical application
Production line screening where IC is used for qualification
OEM qualification, failure investigation, process validation
Ionic Contamination in Automotive Electronics & Why the Stakes Are Higher
Ionic contamination matters in all electronics applications, but the consequences in automotive electronics are more severe than in most other sectors. Automotive electronics operate in conditions that maximise the risk of ionic contamination driven failure: wide temperature cycling that promotes condensation, vibration that can crack conformal coatings and expose underlying surfaces, extended service lives measured in decades rather than years, and safety-critical functions where intermittent faults have direct consequences for driver safety.
An engine control unit that develops an intermittent fault from ionic contamination-driven leakage current is not a product return. It is potentially a safety incident, a warranty campaign, and a significant engineering investigation. The cost difference between finding ionic contamination before shipment by IC testing, and finding it after installation in vehicles through field failures, is several orders of magnitude.
For automotive electronics manufacturers in Malaysia and Southeast Asia, the ionic contamination testing requirement typically enters the supply chain through OEM qualification requirements, customer cleanliness specifications, or process qualification programmes. Where no specific limit has been defined by the customer, the IPC standards provide a framework for establishing appropriate internal cleanliness limits based on the application criticality.
For the full range of chemical and electronics testing services including ionic contamination analysis: https://www.alstesting.co.th/anion-test-specialist-malaysia/
Ionic Contamination and Component Cleanliness & The Connection
Ionic contamination testing on PCBs and technical cleanliness testing on precision mechanical components address the same fundamental problem from different perspectives: contamination that is invisible to standard inspection methods but causes field failures in service. The analytical techniques differ but the quality management principle is identical.
For manufacturers who produce both precision mechanical components and automotive electronics, or who supply into supply chains that require both types of testing, understanding the connection between the two disciplines helps in establishing a coherent quality testing programme. In both cases, the contamination is measured at a level of precision that only accredited laboratory analysis can provide, the results are compared against defined limits, and the findings drive corrective action in the manufacturing process.
For technical cleanliness testing of precision mechanical components to ISO 16232 and VDA 19: https://www.alstesting.co.th/technical-cleanliness-testing/
Ion Chromatography at ALS Testing
ALS Testing provides anion and cation analysis by ion chromatography to IPC-TM-650 2.3.28 for PCB assemblies, individual components, and process solution analysis. Our IC capability covers the full range of ionic species relevant to electronics reliability assessment: the primary anions including fluoride, chloride, bromide, nitrate, phosphate, sulfate, acetate, and formate; and the primary cations including sodium, potassium, ammonium, and the amine species associated with no-clean flux residues.
All ionic contamination testing at ALS is conducted within our ISO/IEC 17025:2017 accredited quality management system. Results are reported with individual species concentrations in micrograms per square centimetre, compared against the limits specified in your cleanliness specification or OEM requirement, with clear pass/fail designation for each species and for the total ionic contamination level.
Our reports include the full IC chromatogram data alongside the tabulated results, enabling your engineering team to review the species profile and make informed decisions about corrective action priorities. For investigations where elevated ionic contamination has been detected and source tracing is required, we can design follow-up sampling strategies including area-specific extractions to localise contamination to specific board regions or process steps.
Summary
Anion and cation testing by ion chromatography is the definitive analytical method for ionic contamination assessment of PCBs and automotive electronics assemblies. It identifies individual ionic species at concentrations that are analytically significant but invisible to all other inspection methods, enabling both pass/fail qualification and diagnostically useful information about contamination sources and corrective actions.
The primary standard for the test is IPC-TM-650 2.3.28. The most diagnostically significant species are chloride on the anion side, which indicates aggressive corrosion risk, and ammonium and organic amines on the cation side, which indicate active no-clean flux residues that retain corrosion-promoting properties. IC supersedes ROSE testing in diagnostic value and is the method required by automotive OEM cleanliness specifications.
For automotive electronics manufacturers, the cost of finding ionic contamination before shipment through IC testing is a small fraction of the cost of the field failures it prevents. For production-line application, IC provides the species resolution that allows root cause investigation and targeted process improvement rather than pass/fail screening alone.
Next Steps
See our full Chemical and Electronics Testing services including ionic contamination analysis: https://www.alstesting.co.th/anion-test-specialist-malaysia/
Learn about technical cleanliness testing for precision mechanical components: https://www.alstesting.co.th/technical-cleanliness-testing/
Contact our team for an IC testing quotation or technical consultation: https://www.alstesting.co.th/contact-us/
Read moreJune 2, 2026
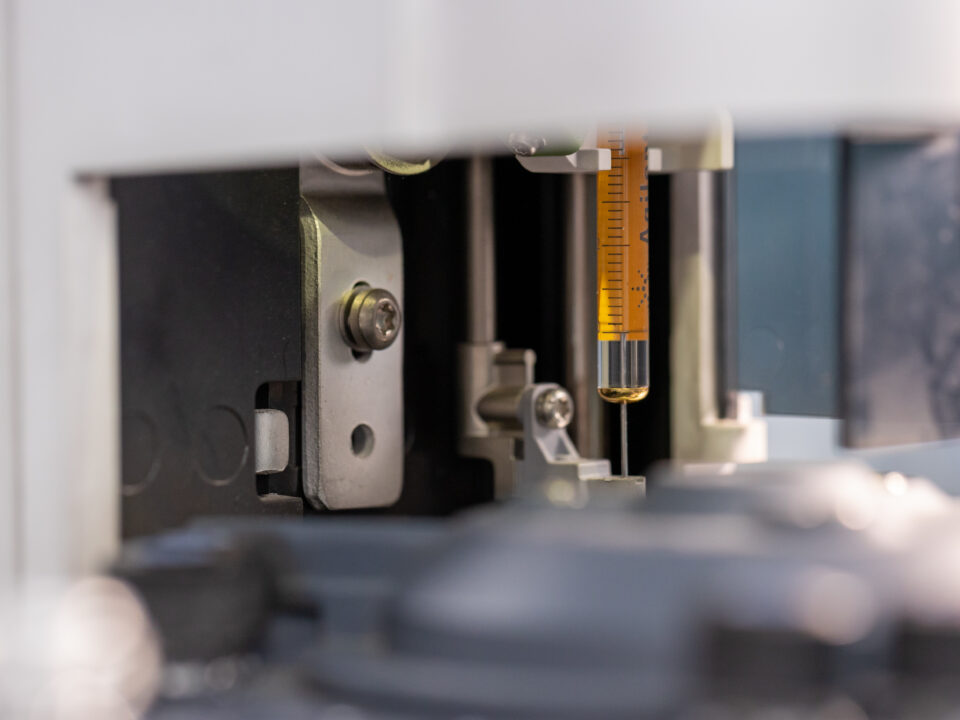
Walk into a new car and you notice it immediately. That distinctive new-vehicle smell is not a design feature. It is the combined off-gassing of dozens of materials installed in the cabin: adhesives curing under the instrument panel, plasticisers migrating from PVC surfaces, flame retardants volatilising from foam seating, solvent residues evaporating from trim adhesives. Most of these compounds dissipate over weeks and months. Some of them, at high enough concentrations, raise health concerns.
This is the problem that VOC testing for automotive interiors is designed to address. For materials and components suppliers in the automotive supply chain, VOC testing is not optional. It is a qualification gate that your interior material must pass before an OEM will approve it for production, and increasingly it is a regulatory requirement in markets where cabin air quality limits are defined by law.
This article explains what automotive VOC testing involves, which standards govern it, how the laboratory methods work, and what you need to prepare before submitting materials for testing.
What Are VOCs and Why Do They Matter in Automotive Interiors?
VOC stands for volatile organic compound. The term covers a broad class of carbon-based chemicals that evaporate readily at room temperature or under mild heating. In the context of automotive interior materials, VOCs originate from the raw materials used in manufacturing, from residual processing chemicals, and from the chemical reactions that continue as materials age, heat, and interact with each other inside the vehicle cabin.
The interior of a modern vehicle is a complex assembly of polymer components: instrument panels, door trim, headliners, seat foams, floor carpets, steering wheels, and the adhesives and coatings that hold them together. Each of these materials has a VOC emission profile. In a sealed cabin at ambient temperature, the combined emissions from all interior materials accumulate to define the overall cabin air quality.
At low concentrations, most VOCs are not acutely harmful. At higher concentrations, compounds including benzene, toluene, xylene, formaldehyde, and acetaldehyde are associated with eye and respiratory irritation, headache, and in the case of benzene and formaldehyde, longer-term health concern. The regulatory and OEM response has been to define maximum permissible emission limits for individual compounds and compound groups, enforced through material qualification testing at the supplier level.
The materials in a vehicle cabin are tested individually by the supplier before assembly. By the time a vehicle reaches the consumer, every significant interior material has been qualified against VOC emission limits. VOC testing is where that qualification happens.
For automotive materials suppliers in Malaysia and Southeast Asia, the primary VOC testing requirements come from two directions: German OEM specifications referencing VDA 278 and associated standards, and broader international specifications referencing ISO 12219. Suppliers who serve both markets, or who supply into global Tier-1 supply chains, often need to satisfy both frameworks.
The Key Standards for Automotive VOC Testing
VDA 278 Thermal Desorption Analysis
VDA 278 is the most widely referenced standard for VOC and semi-volatile organic compound (SVOC) analysis of automotive interior non-metallic materials. It is published by the VDA, the German Automotive Industry Association, and is required by German OEMs including BMW, Volkswagen Group, Mercedes-Benz, and Audi, as well as by the broader Tier-1 supply chains that serve these customers.
The method uses thermal desorption combined with gas chromatography and mass spectrometry (TD-GC-MS). A small sample of the material, typically one to three grams, is placed in a glass sample tube and heated in two stages. The first heating stage at 90 degrees Celsius drives off the volatile organic fraction, corresponding to compounds with boiling points up to approximately 250 degrees Celsius. The second heating stage at 120 degrees Celsius drives off the semi-volatile or fogging fraction, corresponding to higher-boiling condensable compounds.
The compounds emitted at each stage are collected on a Tenax sorbent tube, then thermally desorbed and injected into the GC-MS system for identification and quantification. Results are reported in micrograms per gram of material for the VOC fraction and separately for the SVOC or FOG fraction. Pass/fail assessment is made against the emission limits specified in the relevant OEM or customer specification.
VDA 278 produces a compound-by-compound profile of emissions. For each individual compound identified above the reporting threshold, the result includes the compound name, its CAS number, and its concentration. This level of detail is important because OEM specifications typically define limits for specific compound categories (for example, total aromatic hydrocarbons, or individual aldehyde limits) rather than a single total VOC number.
ISO 12219 The International Standard Series
ISO 12219 is a multi-part international standard covering VOC measurement in vehicle interiors. Different parts address different aspects and scales of measurement.
ISO 12219-1 covers VOC measurement in complete vehicle cabins using the bag method: the vehicle is sealed under defined conditioning conditions and a sample of cabin air is collected in a Tedlar bag for subsequent analysis. This is used for type approval and vehicle-level compliance, rather than material-level supplier qualification.
ISO 12219-2 through to ISO 12219-7 cover VOC emission measurement from individual components and materials using chamber methods of varying scales, from large climate chambers down to micro-scale chamber devices. These methods are used at the material and component qualification stage and are referenced by OEM specifications that align with ISO rather than VDA frameworks.
For most materials suppliers, the relevant parts of ISO 12219 are those covering component-level testing, which is where individual materials are assessed before vehicle assembly. If your OEM specification references ISO 12219, confirm which specific part or parts are required and at what test conditions.
VDA 275 Formaldehyde by Photometric Analysis
Formaldehyde is a specific VOC that receives dedicated attention in automotive interior specifications. It is emitted from wood-based composites, certain adhesives, and resins used in interior components, and is subject to individual emission limits that are typically tighter than the general aldehyde group limits applied in thermal desorption analysis.
VDA 275 defines a bottle method for formaldehyde determination: the sample is placed in a sealed glass bottle with distilled water and conditioned at 60 degrees Celsius for three hours. The formaldehyde emitted into the headspace dissolves in the water and is quantified by UV-Vis spectrophotometry using a colorimetric reagent. Results are expressed in micrograms per gram of material. This dedicated method is more sensitive and specific for formaldehyde than the thermal desorption approach used in VDA 278, and is required separately by most German OEM specifications.
ISO 6452 Fogging Testing
Fogging is a related but distinct phenomenon. It refers to the deposition of condensable vapours from interior materials onto the vehicle windscreen as a visible film. The fog film impairs driver visibility and is particularly problematic in cold weather conditions when the windscreen temperature is low enough to promote condensation. ISO 6452 defines both gravimetric and photometric methods for fogging assessment.
In the gravimetric method, a sample is heated in a glass beaker and the vapours condense on a cooled aluminium foil disc placed above the sample. The mass of the deposit is the fogging result. In the photometric method, the deposit forms on a glass disc and is measured by change in reflectance before and after the test. Different OEM specifications reference different methods and apply different acceptance criteria.
Where HPLC Fits in VOC Testing
High performance liquid chromatography (HPLC) is not the primary technique in automotive VOC testing, where thermal desorption GC-MS is the dominant method. However, HPLC plays a specific and important role in the analysis of certain compounds that are not well-served by GC-MS approaches.
The most significant application of HPLC in automotive VOC testing is the analysis of carbonyl compounds, particularly aldehydes and ketones. Formaldehyde, acetaldehyde, acrolein, benzaldehyde, and other carbonyls are collected by drawing air or headspace vapour through a cartridge impregnated with 2,4-dinitrophenylhydrazine (DNPH). The carbonyl compounds react with DNPH to form stable hydrazone derivatives, which are then eluted from the cartridge and analysed by HPLC with UV detection.
This DNPH-HPLC method provides better sensitivity and specificity for individual aldehyde species than thermal desorption GC-MS, and is specified by some OEM and regulatory frameworks for carbonyl compound determination. ISO 16000-3, which covers determination of formaldehyde and other carbonyl compounds in indoor air, uses this DNPH-HPLC approach, and it is applied in some automotive interior air quality programmes where individual aldehyde quantification to low levels is required.
HPLC is the method of choice when individual aldehyde species including formaldehyde need to be quantified at concentrations below the practical range of thermal desorption GC-MS, or where a regulatory framework specifically requires the DNPH-HPLC approach.
If your specification references a DNPH-HPLC method for aldehyde determination, please confirm this requirement at the enquiry stage so our team can advise on the appropriate approach for your application.
Which Materials Require VOC Testing?
Any non-metallic material used inside the vehicle cabin is a potential candidate for VOC testing. In practice, the materials that receive the most attention are those with the highest emission potential or the largest surface area exposed to cabin air.
Material Category
Primary VOC Concern
Typical Standard Applied
Instrument panels and dashboard covers
Aromatic hydrocarbons, plasticisers (SVOC/FOG)
VDA 278, OEM-specific
Headliners and roof lining
Formaldehyde from binder resins, aldehyde compounds
VDA 278, VDA 275
Seat foam (polyurethane)
Amine compounds, acetaldehyde, TDI residues
VDA 278
Floor carpets and underfelt
Formaldehyde from latex binder, styrene
VDA 278, VDA 275
Door trim panels
Aromatic hydrocarbons, plasticisers
VDA 278
Adhesives and sealants
Solvents, residual monomers
VDA 278, customer-specific
Coatings and paints (interior surfaces)
Solvents, residual monomers, reactive diluents
VDA 278, ISO 12219
Steering wheel covers and grips
Plasticisers, rubber processing aids
VDA 278, fogging ISO 6452
Rubber seals and gaskets (interior-facing)
Sulfur compounds, plasticisers
VDA 278
Wire insulation and cable jacketing
Plasticisers, flame retardant emissions
VDA 278, customer-specific
The test requirement is typically defined in the material specification or the OEM supplier quality manual. If you are uncertain whether your material requires VOC testing and to which standard, the starting point is the customer’s material specification document or the PPAP requirement list for the programme.
The VOC Testing Process: From Sample to Report
Sample Conditioning and Preparation
The conditioning of material samples before testing is defined by the standard and significantly affects the results. VDA 278 specifies that samples should be conditioned at 23 degrees Celsius and 50 percent relative humidity for seven days before testing, in a clean environment free from interfering VOC sources. This conditioning period allows the initial burst of highly volatile compounds from freshly manufactured or packaged materials to stabilise, so that the test reflects the material’s emission profile under conditions more representative of normal cabin use.
The sample size is defined by VDA 278: typically one to three grams of material, cut to fit the sample tube. Sampling location matters for heterogeneous materials – the test result reflects the specific layer or region of the material that was sampled, not necessarily the entire component. For composite materials with multiple layers, different layers may be tested separately if their VOC profiles are likely to differ significantly.
Thermal Desorption and GC-MS Analysis
The conditioned sample is placed in the thermal desorption tube and the tube is loaded into the thermal desorption unit. The tube is purged with carrier gas while being heated to the first temperature stage (90 degrees Celsius for the VOC fraction), and the desorbed compounds are collected on the cold Tenax trap. The trap is then rapidly heated and the collected compounds are injected as a concentrated plug into the GC column.
Separation by gas chromatography resolves the mixture of compounds into individual peaks. Each peak is identified by comparison with reference compound spectra in the mass spectrometry library and confirmed by retention time matching with reference standards. Quantification uses either external calibration against reference standards of individual compounds, or a total ion chromatogram approach with a representative standard compound for groups of similar compounds.
The SVOC or FOG fraction is determined by repeating the desorption procedure at 120 degrees Celsius with a new sample or with the same sample after the VOC desorption stage, depending on the protocol specified.
Reporting and Pass/Fail Assessment
The test report lists each identified compound by name, CAS number, and concentration in micrograms per gram of material. Compounds are grouped by chemical class: aromatic hydrocarbons, aldehydes, ketones, alcohols, esters, and other categories. The total concentration within each class and the overall total VOC (TVOC) are calculated and reported alongside the individual compound data.
Pass/fail assessment is made by comparing measured concentrations against the limits defined in the applicable OEM specification. Limits may be defined as individual compound limits (for example, formaldehyde below 10 micrograms per gram), group limits (for example, total aromatic hydrocarbons below 100 micrograms per gram), and overall TVOC limits. A material fails if any individual limit or group limit is exceeded.
Common Reasons for VOC Test Failure and What to Do
Understanding why materials fail VOC tests is as useful as understanding what the tests measure. The most common failure causes in automotive interior materials are:
Residual processing solvents: adhesives, coatings, or laminates that have not been fully cured or dried before testing. The solution is typically process optimisation to ensure adequate cure or drying conditions before material dispatch.
Plasticiser migration: high-boiling phthalate or non-phthalate plasticisers from PVC or flexible polymer components contributing to the SVOC or FOG fraction. Reformulation with lower-emission plasticisers, or reduction of plasticiser loading, is the typical response.
Formaldehyde from binder resins: textile materials, wood composites, and certain foam systems use formaldehyde-based binder resins. Low-emission or formaldehyde-free binder alternatives are available for most applications.
Amine compounds from polyurethane foam: certain foam formulations emit amine compounds as the urethane reaction proceeds. Catalyst selection and foam formulation adjustment can reduce amine emissions.
Contamination during conditioning or packaging: if samples are conditioned or stored in environments with high ambient VOC levels, background contamination can elevate results. Clean conditioning environments and clean packaging materials are essential.
In most cases, VOC test failures are solvable through material formulation adjustment, process optimisation, or changes to raw material selection. The failure report from an accredited laboratory identifies the specific compounds responsible, which provides the information needed to target corrective action precisely.
VOC Testing at ALS Testing
ALS provides VOC testing for automotive interior materials to VDA 278, VDA 275, and ISO 12219 frameworks. For aldehyde-specific determination requirements, please contact our technical team to confirm the appropriate method for your specification. Our testing is conducted within our ISO/IEC 17025:2017 accredited quality management system, with results formatted to meet OEM submission requirements.
Our reports include the full compound-by-compound profile with compound identification, CAS numbers, concentrations, and pass/fail assessment against the specified limits. For clients submitting materials for German OEM qualification programmes, our reports are structured to meet the documentation requirements of the relevant OEM supplier quality system.
We serve materials suppliers and component manufacturers across Malaysia and Southeast Asia, with experience across the full range of automotive interior material types: polymers, foams, textiles, adhesives, coatings, and composite structures. If your specification falls outside the standard VDA 278 or ISO 12219 framework, our technical team will review the requirement and advise on the appropriate test method.
Summary: What You Need to Know Before Submitting
VOC testing for automotive interiors is a qualification requirement, not a formality. The standard you test to is determined by your OEM or customer, not by your preference: German OEMs require VDA 278 and typically VDA 275 for formaldehyde; international OEMs reference ISO 12219. Both frameworks require testing by an ISO/IEC 17025 accredited laboratory for formal qualification purposes.
The compounds that most commonly drive failures are residual solvents, plasticisers, formaldehyde from binder resins, and amine compounds from polyurethane processing. Identifying which compound drove a failure is the starting point for effective corrective action.
Where specifications require aldehyde-specific determination at high sensitivity, DNPH-HPLC is a complementary approach applied in addition to thermal desorption GC-MS. It is not a replacement for GC-MS, which remains the primary method across both VDA 278 and ISO 12219 frameworks.
Next Steps
See our full Materials and Environmental Testing services for automotive: https://www.alstesting.co.th/automotive-materials-environmental-testing-als-testing/
Read our detailed VDA 278 explainer including test conditions and reporting format: /blog/vda-278-explainer/
Back to Automotive Testing Hub for the full service overview: https://www.alstesting.co.th/automotive-testing-services-als-testing-laboratory/
Contact our team for a VOC testing quotation or technical discussion: https://www.alstesting.co.th/contact-us/
Read moreJune 2, 2026
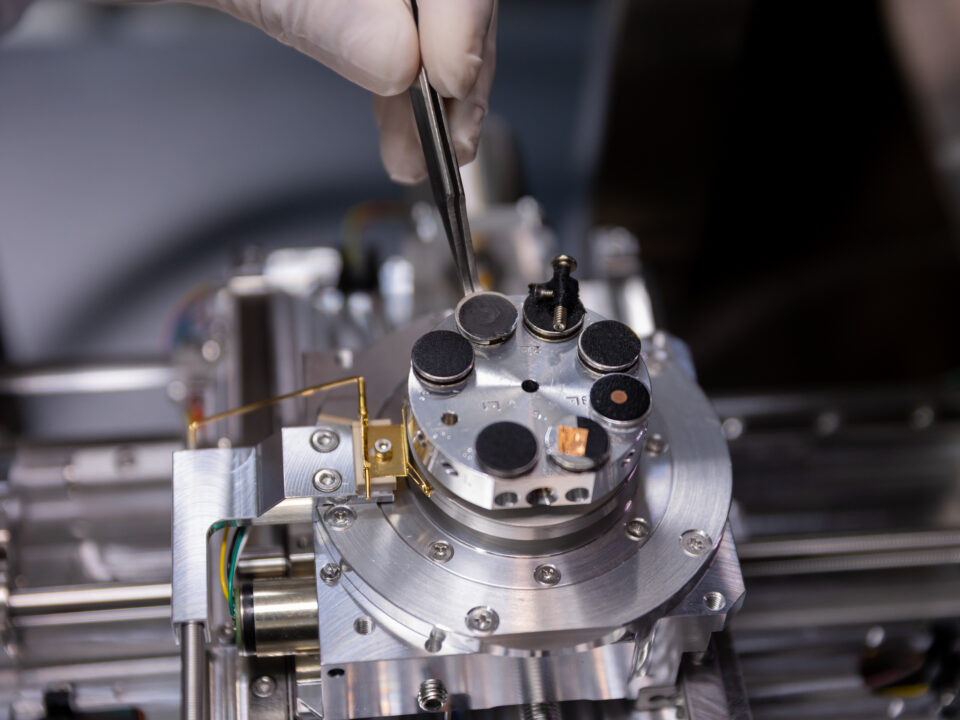
When an automotive component fails in the field, or returns from an OEM qualification test with an unexplained result, the investigation eventually reaches a question that cannot be answered with a magnifying glass. The fracture surface looks unusual under optical microscopy, but the relevant features are below the resolution limit. The corrosion morphology suggests a specific mechanism, but you cannot confirm it from a visual examination. A particle was found on a critical surface, but its identity and origin are unknown.
Scanning electron microscopy resolves that question. SEM is the analytical bridge between what you can observe at the macro scale and what you need to know at the micro and nano scale. It is the single most powerful imaging tool available for failure analysis work in automotive manufacturing, and it is the technique that separates a surface-level investigation from a definitive root cause conclusion.
This article explains how SEM analysis works, what makes it uniquely suited to automotive failure investigation, and the specific applications where it delivers information that no other technique can provide.
How Scanning Electron Microscopy Works
Optical microscopy uses visible light to form an image. The resolution limit of optical microscopy is set by the wavelength of light, which constrains maximum useful magnification to approximately 1,000 to 2,000 times. Beyond that limit, the image becomes blurred rather than more detailed. For many failure analysis scenarios, this is insufficient. Fatigue striations, grain boundary features, corrosion pit morphology, and the surface texture of fracture faces all occur at scales that demand higher resolution.
Scanning electron microscopy replaces the light beam with a focused beam of electrons. Electrons have a wavelength several orders of magnitude shorter than visible light, which is what allows SEM to achieve resolution several hundred times greater than optical microscopy. The practical result is that SEM can produce sharp, detailed images at magnifications from approximately 20 times up to 100,000 times or higher, with a depth of field that is far greater than optical microscopy at equivalent magnifications.
The operating principle is sequential scanning. The electron beam is rastered across the sample surface in a grid pattern. At each point, the beam interacts with the sample and generates signals that are detected and used to construct the image. The most commonly used signal in standard SEM imaging is secondary electrons, which are low-energy electrons ejected from the sample surface by the primary beam. Because secondary electron emission is highly sensitive to surface topography, secondary electron images show the three-dimensional texture of the sample surface with exceptional clarity.
A second commonly used signal is backscattered electrons, which are primary beam electrons reflected back from the sample by elastic scattering. Backscattered electron intensity is strongly dependent on the atomic number of the elements in the sample: heavier elements appear brighter and lighter elements appear darker. This makes backscattered electron imaging valuable for identifying compositional contrast across a sample surface, for example distinguishing different phases in an alloy microstructure or identifying heavy-element inclusions in a polymer matrix.
SEM gives you the surface of a component or fracture face at a scale where the failure mechanism leaves its clearest physical record. What happened to a component is written in features that are tens to hundreds of micrometres in size. SEM reads that record.
Sample Preparation for SEM
Most metallic and ceramic samples can be imaged directly in the SEM without preparation, provided they are clean and appropriately sized for the sample chamber. Non-conducting samples, including most polymers, rubber, and unfilled ceramics, require a thin conductive coating applied by sputter deposition, typically gold, platinum, or carbon, to prevent the sample surface from charging under the electron beam. Charging causes image distortion and artefacts that interfere with analysis. The coating layer is typically 5 to 20 nanometres thick and does not obscure the surface features of interest.
For cross-section analysis, samples are prepared by cutting through the area of interest, embedding in a low-shrinkage resin, and grinding and polishing to a metallographic finish. This reveals the internal structure of the component at the cut plane, including coating layers, grain structure, crack paths, and interface morphology, all of which can then be imaged and analysed by SEM.
Sample preparation is a critical step that directly affects the quality of SEM results. Contamination introduced during preparation, or damage to fracture surfaces from careless handling, can mask or destroy the very features the analysis is designed to reveal. Experienced analysts handle samples with this in mind from the moment of receipt.
SEM Resolution and Magnification & What the Numbers Mean in Practice
Resolution and magnification are related but distinct concepts. Magnification tells you how many times larger the image is than the object. Resolution tells you the smallest feature the instrument can distinguish as separate from its neighbour.
Modern SEM instruments achieve practical working resolution of 3 to 20 nanometres depending on the instrument type and operating conditions. For most automotive failure analysis work, working resolution of 10 to 50 nanometres is sufficient to resolve the features of interest. In practice, the resolution achieved on a real sample depends on the sample condition, the accelerating voltage used, and the detector configuration. For most failure analysis work in automotive applications, working resolution of 10 to 50 nanometres is sufficient to resolve the features of interest.
The magnification range that covers most automotive failure analysis work is from 50 times to 10,000 times. At 50 to 200 times, SEM provides overview imaging of fracture surfaces and corrosion zones that gives context before higher magnification is applied. At 500 to 2,000 times, the characteristic features of specific failure mechanisms become clearly visible: fatigue striations, cleavage facets, intergranular fracture paths, corrosion pit morphology. Above 5,000 times, fine microstructural features, nano-scale corrosion products, and the surface morphology of individual particles can be resolved.
Magnification Range
What It Shows
Typical Application
20x to 200x
Overview of fracture faces, corrosion zones, large defects
Initial characterisation, failure site mapping
200x to 1,000x
Fracture morphology, crack initiation sites, gross microstructural features
Failure mechanism identification
1,000x to 5,000x
Fatigue striations, cleavage facets, grain boundary details, corrosion pits
Root cause determination, mechanism confirmation
5,000x to 20,000x
Fine microstructural features, corrosion product morphology, thin film details
Detailed mechanism analysis, corrosion characterisation
20,000x and above
Nano-scale features, particle surface morphology, ultra-thin coating details
Advanced characterisation, research-level analysis
SEM-EDX Combining Imaging with Elemental Analysis
SEM imaging tells you what a feature looks like. Energy-dispersive X-ray spectroscopy (EDX), also written EDS, tells you what it is made of. The two techniques are routinely operated together, using the same electron beam in the same instrument, and together they are more powerful than either technique alone.
When the primary electron beam interacts with the sample, it generates X-rays whose energies are characteristic of the elements present. Each element produces X-rays at specific, known energies: iron at 6.4 keV, aluminium at 1.49 keV, chlorine at 2.62 keV, and so on. The EDX detector measures the energy and intensity of these X-rays, producing a spectrum that identifies which elements are present and at what relative concentrations.
In automotive failure analysis, SEM-EDX is applied in three primary ways. Point analysis targets a specific feature identified in the SEM image and produces an elemental spectrum for that location. This is used to identify a corrosion product, confirm the composition of an inclusion, or characterise a contaminating particle. Area analysis averages the elemental composition across a defined region of the sample, providing a bulk compositional snapshot. Elemental mapping uses the EDX signal to construct colour-coded maps showing where specific elements are distributed across the imaged area, revealing elemental gradients, segregation, and the spatial relationship between different phases or contamination layers.
The combination of SEM morphological imaging and EDX elemental identification is the most information-dense single analytical step available in failure analysis. It simultaneously answers what happened and what it happened to.
EDX does have limitations that experienced analysts account for. It is a surface technique with a sampling depth of approximately 1 to 2 micrometres at typical operating voltages. Quantification accuracy depends on sample geometry and is less precise for light elements (below sodium in the periodic table, including carbon, nitrogen, and oxygen) than for heavier elements. For definitive quantitative analysis of light elements or trace concentrations, EDX results are confirmed by complementary techniques such as FTIR for organic identification or ICP-MS for trace elemental quantification.
For a deeper look at EDX elemental analysis and its role in failure investigation, see our dedicated EDX Analysis guide: /blog/edx-analysis/
Automotive Applications of SEM Analysis
SEM analysis is applied across a wide range of failure scenarios in automotive manufacturing and service. The following are the most significant application areas in the context of ALS’s failure analysis work.
Fracture and Fatigue Analysis
Fracture surfaces are the primary domain of SEM in automotive failure analysis. The mechanism of a fracture leaves characteristic morphological signatures on the fractured faces, and SEM imaging at appropriate magnification reveals these signatures clearly.
Fatigue fractures are identified by the presence of fatigue striations: closely spaced parallel marks that represent the crack front position at each load cycle. Striations are typically visible at magnifications of 1,000 to 5,000 times, and their spacing provides information about the crack growth rate per cycle. The initiation site of a fatigue crack is identifiable in the SEM image by the convergence of striation patterns and is typically associated with a stress concentration: a surface defect, a machining mark, a corrosion pit, or an inclusion.
Brittle fracture modes leave different signatures. Cleavage fracture in crystalline metals produces flat, faceted fracture surfaces aligned with specific crystallographic planes, visible in SEM as bright, planar areas with characteristic river line patterns. Intergranular fracture, where the crack propagates along grain boundaries rather than through grains, produces a faceted surface where individual grain surfaces are visible. This mode is associated with grain boundary embrittlement from hydrogen absorption, temper embrittlement, or grain boundary corrosion.
Ductile overload fracture produces a dimpled surface morphology at the microscale, where micro-voids nucleate at inclusions or particles and coalesce as the material deforms. The presence and size of dimples, and whether they are equiaxed or elongated, provides information about the stress state at fracture.
Corrosion Characterisation
SEM imaging characterises the morphology of corrosion damage in detail that cannot be achieved by optical microscopy. Pitting corrosion is identified by the hemispherical or crystallographic pit geometry and the presence of corrosion product deposits within and around the pits. The EDX spectrum of the corrosion products identifies the mechanism: chloride-rich corrosion products indicate chloride-induced pitting, sulfate-rich products indicate sulfuric acid attack, and the presence of zinc, chromate, or other coating elements indicates breakdown of the protective layer.
Crevice corrosion, galvanic corrosion at bimetallic interfaces, and stress corrosion cracking all have distinctive SEM signatures. Stress corrosion cracking produces branched or transgranular crack morphology that SEM distinguishes clearly from mechanical fatigue. Cross-section SEM imaging of corroded surfaces shows the depth and morphology of the corroded zone, the integrity of any remaining coating, and the relationship between the corrosion front and the underlying microstructure.
Contaminant and Particle Identification
When foreign particles are found on automotive component surfaces, in hydraulic fluids, on electrical contacts, or on PCB surfaces, SEM-EDX provides the most direct path to identification. The morphology of a particle (rounded, angular, fibrous, platelet-shaped) narrows the candidate material types. The EDX elemental composition provides positive identification: an iron-rich angular particle is consistent with machining swarf, a silicon and oxygen-rich particle suggests a silicate mineral contaminant, a carbon-rich fibrous particle indicates organic fibre contamination.
This combination of morphological and compositional information is essential for contamination source investigation. Identifying not just that contamination is present but where it likely originated from allows targeted corrective action in the manufacturing process. In cleanliness testing applications where particles are extracted from precision components and collected on filter membranes, SEM-EDX analysis of specific particles from the filter provides the particle identification data required by some OEM cleanliness specifications and by failure investigations where particle composition is central to the root cause.
Coating and Surface Treatment Analysis
SEM cross-section analysis is the primary tool for characterising the thickness, morphology, and integrity of coatings, platings, and surface treatments on automotive components. A properly prepared cross-section through a coated surface reveals each layer in the coating stack with nanometre-scale detail: the base material microstructure, the interface between base material and coating, each individual coating layer and its thickness uniformity, and any defects such as porosity, cracking, or delamination planes within the coating.
EDX line scan analysis across the cross-section shows how the elemental composition transitions from one layer to the next, identifying the composition of each layer and detecting diffusion zones, interdiffusion effects, or contaminating species at layer interfaces. This is particularly relevant for investigation of adhesion failures, where the locus of failure (whether it occurred within a layer or at an interface) determines whether the failure is a coating process problem, a surface preparation problem, or a design problem.
PCB and Automotive Electronics Failure Analysis
Electronic components and PCB assemblies in automotive applications are subject to increasingly stringent reliability requirements, driven by the safety-critical nature of automotive control systems. SEM analysis is central to failure investigation in this domain.
Solder joint failures are characterised by SEM to distinguish fatigue-driven cracking from brittle intermetallic fracture, from dewetting and non-wet opens caused by poor solderability. The fracture morphology and the composition of the solder and intermetallic layers identified by EDX provide the evidence to determine root cause. Corrosion and dendritic growth failures on PCB surfaces are investigated by SEM to characterise the morphology of the corrosion product and identify the ionic species responsible through EDX analysis. The distribution and density of corrosion sites across the board provides information about whether contamination was local or global, which guides the corrective action.
For PCB ionic contamination analysis and chemical cleanliness investigation, see our Chemical and Electronics Testing services: https://www.alstesting.co.th/anion-test-specialist-malaysia/
SEM vs Optical Microscopy & When to Use Each
SEM and optical microscopy are complementary techniques. In a structured failure analysis investigation, both are used, with optical microscopy providing the initial characterisation and SEM providing the higher-resolution detail needed to reach a definitive conclusion.
Dimension
Optical Microscopy
SEM Analysis
Maximum useful magnification
1,000x to 2,000x
Up to 100,000x or higher
Resolution
0.2 micrometres (diffraction limited)
Typically 3 to 20 nm (varies by instrument/settings)
Depth of field
Low – challenging for rough fracture surfaces
High – excellent for three-dimensional surfaces
Colour imaging
Yes – colour information from reflected light
No – greyscale images only (BSE gives compositional contrast)
Elemental analysis
Not available
Available via EDX – point, area, and map
Sample preparation
Minimal for most samples
Coating required for non-conducting samples
Throughput
Fast – rapid overview imaging
Slower – higher setup time per sample
Best application
Initial survey, large-area overview, surface colour assessment
High-resolution characterisation, elemental identification, fine feature analysis
Cost
Lower per hour
Higher per hour – more information per analysis
The practical workflow in failure analysis begins with stereo microscopy for large-area overview and failure site identification, moves to optical microscopy for initial characterisation at intermediate magnifications, and then applies SEM for the high-resolution imaging and EDX elemental analysis that establishes root cause. This sequence preserves the most informative analytical steps and ensures that SEM time is focused on the features that matter most.
What SEM Analysis Cannot Do
Understanding the limitations of SEM is as important as understanding its capabilities. SEM is an imaging and elemental analysis technique. It is not a molecular identification technique: it can tell you that a particle contains carbon, oxygen, and iron, but it cannot tell you whether the organic phase is a polyamide, a polyester, or an epoxy. For molecular identification of organic materials, FTIR spectroscopy is the appropriate complementary technique.
SEM is also a surface technique. Without cross-section preparation, it analyses only the surface of the sample. Subsurface features, internal cracks, and through-thickness compositional gradients are not visible in surface SEM imaging without sectioning. For volumetric characterisation, techniques such as serial cross-section analysis or X-ray computed tomography (available at specialist facilities) are required.
EDX quantification is more accurate for heavier elements than for light elements. Carbon, nitrogen, and oxygen are detectable but quantified with lower accuracy than elements from sodium and above in the periodic table. When precise quantification of light elements is required, complementary techniques including combustion analysis or carrier gas hot extraction are used.
These limitations are not reasons to avoid SEM. They are reasons to use it as part of a structured, multi-technique failure analysis programme where each technique’s output builds on and is corroborated by the others.
SEM Analysis at ALS Testing
ALS Testing provides SEM and SEM-EDX analysis as part of our automotive failure analysis services. Our SEM capability covers the full range of applications described in this article: fracture and fatigue analysis, corrosion characterisation, contaminant and particle identification, coating cross-section analysis, and PCB and electronics failure investigation.
All SEM analysis at ALS is conducted within our ISO/IEC 17025:2017 accredited quality management system, with documented equipment calibration, analyst qualification records, and sample traceability throughout. Our reports include representative SEM images with scale bars, magnification data, and operating conditions, supported by EDX spectra and maps where elemental characterisation is part of the investigation scope. Reports are formatted to support OEM submission, warranty dispute documentation, and technical engineering review.
Our failure analysis team has experience across the full range of automotive materials and component types: metals, polymers, composites, coatings, adhesives, and electronics assemblies. When a failure reaches the SEM stage, we have the context and the technical depth to connect what we see in the image to what was happening in the manufacturing process or service environment.
Summary
Scanning electron microscopy is the central imaging tool of automotive failure analysis. It achieves magnifications and resolutions that optical microscopy cannot reach, with a depth of field that makes it uniquely suited to imaging the rough, three-dimensional surfaces of fractures and corrosion zones. When combined with EDX elemental analysis, it identifies not just the morphology of a failure feature but the material it involves.
In automotive applications, SEM analysis is applied to fracture and fatigue investigation, corrosion characterisation, contaminant and particle identification, coating and surface treatment analysis, and PCB and electronics failure investigation. It is the technique that converts a visible failure into a defensible root cause conclusion, supported by documented images and data that hold up in OEM review, warranty proceedings, and regulatory submissions.
Next Steps
See our Failure Analysis services and full SEM capability overview: https://www.alstesting.co.th/failure-analysis-services-sem-ftir-edx-als-testing/
Read our guide to EDX elemental analysis in failure investigation: /blog/edx-analysis/
For PCB and electronics failure analysis including ionic contamination: https://www.alstesting.co.th/anion-test-specialist-malaysia/
Contact our team to discuss a failure investigation: https://www.alstesting.co.th/contact-us/
Read moreJune 2, 2026
At some point in the component qualification process, your OEM or customer will specify a cleanliness requirement. That requirement will reference one of two standards: ISO 16232 or VDA 19. If you have not worked with technical cleanliness testing before, the distinction between them is not immediately obvious. Both cover the same subject. Both are widely used in automotive manufacturing. And in practice, they are more aligned than their different names suggest.
But the differences matter, and choosing the wrong standard for your submission can delay qualification or require retesting. This guide explains what each standard covers, how they relate to each other, and how to determine which one your specific application requires.
Where ISO 16232 and VDA 19 Come From
ISO 16232 is the international standard for technical cleanliness testing in road vehicles. It was developed by ISO Technical Committee 22, the body responsible for road vehicle standards, and is published in ten parts covering the full range of cleanliness test activities – from sampling strategy and extraction methods through to analysis and reporting. Because it is an ISO standard, it is adopted as the reference framework by most international OEMs and by testing laboratories operating outside Germany.
VDA 19 is the equivalent German automotive industry standard, published by the VDA – the Verband der Automobilindustrie, the German Association of the Automotive Industry. It was developed by and for the German automotive industry, and reflects the cleanliness testing practices established by German OEMs over decades of precision component manufacturing. VDA 19 is published in two parts: Part 1 covers particle contamination analysis of functionally relevant automotive components, and Part 2 covers assembly environment requirements for technical cleanliness.
The relationship between them is a deliberate harmonisation. VDA 19 Part 1 and ISO 16232 were aligned through a coordinated revision process, with the result that the two standards are technically equivalent for most cleanliness testing applications. The methods, particle extraction principles, classification logic, and analytical requirements are substantively the same. Where they differ is in specific reporting format details, particle classification notation, and the scope of Part 2 of VDA 19, which has no direct ISO equivalent covering assembly environment requirements.
ISO 16232 and VDA 19 are harmonised standards covering the same testing discipline. Choosing between them is primarily a matter of which your OEM or customer specifies – not a choice between different test methods.
What ISO 16232 and VDA 19 Cover
ISO 16232 Structure and Scope
ISO 16232 is organised as a single consolidated document covering all aspects of cleanliness testing. The key sections for most testing applications are:
Part 5: Cleanliness inspection principles, covering inspection method selection, start parameters, cleaning mechanism parameters, and staff competency requirements.
Part 6: Qualification testing and blank level determination, including routine inspection and double inspection protocols.
Part 7: Extraction methods, covering preparatory and post-treatment steps, liquid extraction, and air extraction approaches.
Part 8: Analysis filtration, defining the filtration method used to prepare extracted particles for examination.
Part 9: Analysis methods, including Standard analysis, Extended analysis, and Shortened analysis, each suited to different testing scenarios.
The full ISO 16232 framework provides a complete methodology from extraction through to reporting, applicable to any automotive component where cleanliness is a functional requirement.
VDA 19 Structure and Scope
VDA 19 Part 1 covers functionally equivalent ground to ISO 16232, with the same core methodology: extraction of particles from the component, gravimetric and light obscuration particle counting, microscopic classification, and cleanliness class assignment. The particle size ranges, classification categories, and reporting principles are aligned with ISO 16232.
VDA 19 Part 2 is distinct. It addresses the assembly environment – the cleanliness requirements for the cleanroom or controlled environment in which precision components are assembled. It defines cleanliness classes for workspaces, tools, personnel, and packaging, providing a framework for controlling contamination introduction during the assembly process. ISO 16232 does not have an equivalent part covering assembly environments, which is why VDA 19 Part 2 remains in active use even among organisations whose component testing follows ISO 16232.
Key Similarities and Differences
For most cleanliness testing applications, the practical similarities between the two standards are more significant than their differences. The table below summarises the key dimensions.
Dimension
ISO 16232
VDA 19
Origin
International (ISO TC 22)
German automotive industry (VDA)
Technical equivalence
Harmonised with VDA 19 Part 1
Harmonised with ISO 16232
Particle extraction methods
Liquid: Pressure rinsing, Ultrasonic, Agitation, Internal rinsing.
Air: Air jet, Air through flow
Liquid: Pressure rinsing, Ultrasonic, Agitation, Internal rinsing.
Dry: Air jet, Air through flow, Stamping, Suction
Gravimetric analysis
Standard analysis
Standard analysis
Light Obscuration Particle Counting (LPC)
Shorten analysis
Shorten analysis
Microscopic particle classification
Standard analysis
Standard analysis
Particle size ranges
Particle size > 50 µm
Particle size > 50 µm
Particle classification types
Metallic, non metallic, fibre
Same categories
Cleanliness class notation
ISO cleanliness class format
VDA cleanliness class format – slightly different notation
Assembly environment
Not covered
Covered in VDA 19 Part 2
Report format
ISO 16232 format
VDA 19 format, different layout conventions
Primary adopters
Global OEMs, non-German automotive markets
German OEMs and their Tier-1 supply chains
The notation difference in cleanliness class reporting is worth noting. Both standards define cleanliness classes based on particle counts per size range, but the way those classes are expressed in the test report differs between the two standards. If your OEM has specified a cleanliness requirement using VDA 19 notation, submitting a report in ISO 16232 format and vice versa can create confusion in the review process, even if the underlying analytical data is identical.
Which Standard Applies to Your Situation?
The straightforward answer: the standard that applies to your situation is the one your OEM or customer has specified. If the specification document, the purchase order, or the supplier quality requirement references VDA 19 – test to VDA 19 and report accordingly. If it references ISO 16232 – test to ISO 16232. Where the customer has specified both, which does happen in supply chains that cross between German and non-German OEM requirements, your laboratory will need to produce a report that addresses both frameworks.
Where no specific standard is referenced, or where you are establishing a cleanliness specification for a new product rather than responding to an OEM requirement, the choice is more open. The following considerations are relevant.
Choose ISO 16232 If…
Your primary customers or OEM relationships are outside Germany – particularly Japanese, American, Korean, or UK-based OEMs
You are testing to support ISO-referencing type approvals or international regulatory submissions
Your laboratory scope or accreditation references ISO 16232 as the test method
You are developing a cleanliness specification for a new component and want maximum international portability
Choose VDA 19 If…
Your customer is a German OEM or a Tier-1 supplier directly serving BMW, Volkswagen Group, Mercedes-Benz, Audi, Bosch, or ZF
The supplier quality manual, PPAP requirements, or component specification explicitly references VDA 19
You are testing for assembly environment qualification as well as component cleanliness – VDA 19 Part 2 is the relevant standard for this
Your existing cleanliness classification system uses VDA 19 notation and you need continuity across historical data sets
When Both Apply
Some Tier-1 suppliers serve multiple OEM relationships that span German and non-German customers. In this case, the same component may need to meet cleanliness requirements under both frameworks. Because the test methods are harmonised, a single test programme can produce data that satisfies both standards, provided the laboratory issues reports in the appropriate format for each customer requirement. Confirm this capability with your laboratory before proceeding, and provide both specification references when submitting your samples.
Because ISO 16232 and VDA 19 are technically harmonised, a single set of test results can satisfy both standards. The difference lies in how the report is formatted and how the cleanliness class is expressed.
A Note on Accreditation
Regardless of which standard your cleanliness test is conducted to, the laboratory producing the results should be accredited to ISO/IEC 17025:2017. This accreditation is the foundation of credibility for your test data. It means that the methods, equipment, and quality system behind your results have been independently audited and verified.
In practice, OEMs and procurement teams reviewing cleanliness test reports will look for the accreditation mark before they assess the results. A non-accredited report, however technically competent the laboratory, is not accepted as formal compliance evidence for OEM qualification, type approval, or regulatory submission purposes.
ALS Testing is accredited to ISO/IEC 17025:2017. Our cleanliness testing capability covers both ISO 16232 and VDA 19, with reports formatted to the appropriate standard for each customer requirement. Our results are accepted by OEMs in more than 100 countries.
Practical Checklist Before You Submit Samples for Cleanliness Testing
Having the right information ready before sample submission helps your laboratory select the correct methods, format the report correctly, and avoid unnecessary follow-up. The following checklist covers the key points.
Confirm the standard: identify whether the OEM or customer specification references ISO 16232, VDA 19, or both
Confirm the cleanliness class requirement: obtain the specified cleanliness class or particle count limits from the specification document
Confirm the component type and critical surfaces: identify which surfaces and channels need to be sampled
Confirm the extraction method: some specifications define the required extraction method; if not, your laboratory will advise based on component geometry
Confirm whether SEM-EDX particle identification is required: some OEM specifications require elemental identification of particles above a defined size. If required, confirm this capability with your laboratory at the enquiry stage.
Confirm report format requirements: if your OEM requires a specific report format or data template, provide this to your laboratory before testing begins
Package samples correctly: seal components in clean polythene bags immediately after manufacture to prevent post-manufacture contamination that would invalidate the test
Summary
ISO 16232 and VDA 19 are technically harmonised standards covering the same testing discipline: the extraction, quantification, and classification of particulate contamination from precision automotive components. The choice between them is driven primarily by your OEM requirement, not by any fundamental difference in the testing process.
German OEMs and their direct Tier-1 suppliers will typically specify VDA 19. Global OEMs outside Germany will typically specify ISO 16232. Where both apply, the harmonised methods allow a single test programme to satisfy both frameworks with appropriate dual reporting.
What matters most in both cases is that the testing is conducted by an ISO/IEC 17025 accredited laboratory with genuine specialist capability in technical cleanliness testing – the extraction methods, particle counting equipment, microscopic analysis, and reporting experience to produce results that your OEM will accept without qualification.
Next Steps
See our full Cleanliness and Particle Testing capability: https://www.alstesting.co.th/technical-cleanliness-testing/
Read our detailed guide to VDA 19 testing requirements: /blog/vda-19-guide/
Download our ISO 16232 test preparation checklist: /blog/iso-16232-checklist/
Contact our team to discuss your cleanliness testing requirements: https://www.alstesting.co.th/contact-us/
Read moreJune 2, 2026
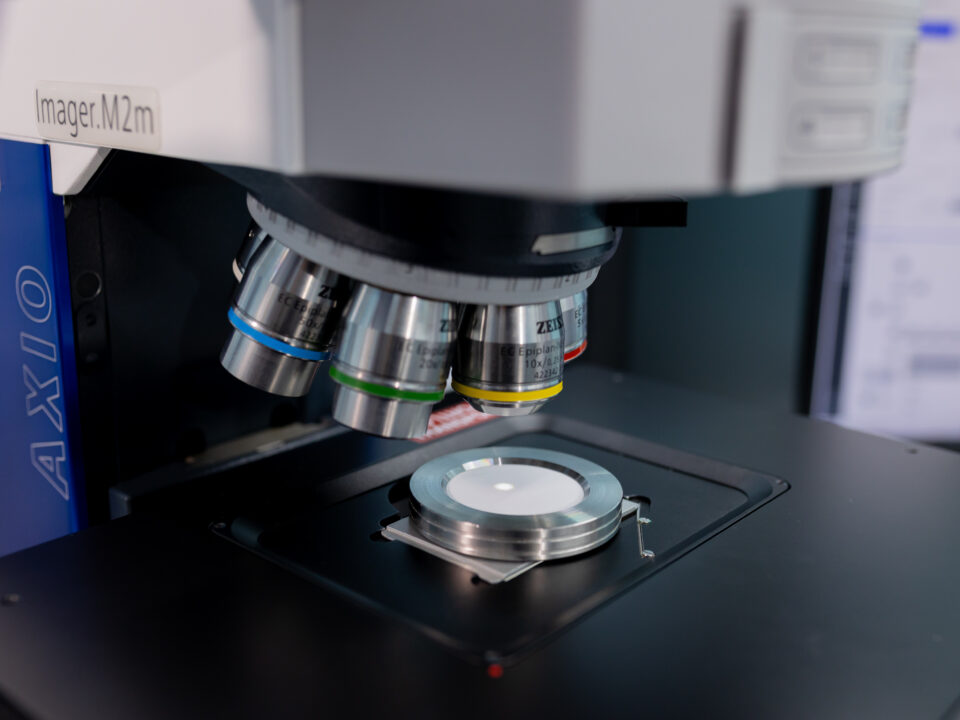
If you are new to the automotive supply chain – or expanding into it – you will encounter the term automotive testing early and often. It appears in OEM qualification documents, supplier quality requirements, and regulatory submissions. It is referenced in purchase orders, quality plans, and audit checklists. But what does it actually mean, and why does it carry so much weight?
This guide answers both questions. It covers what automotive testing is, the main categories it encompasses, how it fits into the manufacturing lifecycle, and what separates a test that gives you confidence from one that simply gives you a result.
The Definition of Automotive Testing
Automotive testing is the systematic evaluation of materials, components, sub-assemblies, and complete vehicle systems against defined specifications. Those specifications may be set by an OEM, a regulatory body, an international standards organisation such as ISO or IEC, or a combination of all three.
The goal is verification. Testing establishes, with documented evidence, that a product does what it is supposed to do, under the conditions it will actually encounter, at the level of precision the application requires. For a hydraulic valve in a transmission, that means cleanliness down to the micron level. For an interior trim panel, it means VOC emissions within prescribed limits. For a PCB in a safety-critical control unit, it means ionic contamination below the threshold that triggers corrosion or leakage current.
Automotive testing is not the same as general product testing. The standards are more demanding, the traceability requirements are stricter, and the consequences of getting it wrong are more severe. That is why the framework around it – accreditation, methodology, and documentation – exists in the form it does.
Automotive testing is verification with consequences. It is the documented evidence that sits between a supplier’s claim and an OEM’s acceptance.
The Main Types of Automotive Testing
Automotive testing covers a wide range of disciplines. In practice, most suppliers will engage with several of these over the course of a product’s lifecycle. Understanding the landscape helps you identify what your specific situation requires.
Technical Cleanliness Testing
Cleanliness testing quantifies the particulate contamination present on or within a precision automotive component. It is governed by ISO 16232 and VDA 19 – the international and German automotive industry standards respectively – and produces a cleanliness class: a formal rating that can be compared directly against the cleanliness specification defined by the OEM or component designer.
Cleanliness matters because particles that are invisible to the eye can cause catastrophic failures in hydraulic systems, fuel systems, and braking systems. A single metallic particle of the wrong size in the wrong place can jam a valve, block an orifice, or score a precision-ground surface. For EV platforms, the cleanliness requirements of battery thermal management circuits and power electronics cooling paths are equally stringent.
The process involves particle extraction from the component, gravimetric analysis to determine total particle mass, light obscuration particle counting to establish size distribution, and in some cases SEM-EDX analysis to identify particle composition. This is specialist work – not every laboratory offers it to the depth that OEM qualifications require.
See our Cleanliness and Particle Testing services for ISO 16232 and VDA 19 capability details. https://www.alstesting.co.th/technical-cleanliness-testing/
Failure Analysis
Failure analysis is the forensic investigation of a component that has failed – in production, in qualification testing, or in the field. The objective is root cause: not just identifying what failed, but tracing the failure back to its physical, chemical, or mechanical origin.
The core techniques are scanning electron microscopy (SEM) for high-magnification surface and fracture imaging, energy-dispersive X-ray spectroscopy (EDX) for elemental identification, FTIR spectroscopy for organic material identification, and metallurgical cross-section preparation for internal microstructural analysis. These techniques are applied in combination, following the failure evidence from the macro scale down to the micro and nano scale.
Failure analysis is applied at every stage of the automotive lifecycle: during development to catch design or material weaknesses early, during qualification when unexpected test failures must be explained, during production to prevent recurrence of non-conformances, and after field returns to determine warranty liability and drive product improvement.
Materials and Environmental Testing
This category covers two related but distinct disciplines. Materials testing evaluates the chemical composition and performance properties of automotive materials – plastics, rubbers, foams, adhesives, coatings, metals, and composites. Environmental testing exposes components and materials to simulated real-world conditions – temperature extremes, humidity, corrosion, UV exposure, vibration – to assess durability and stability.
Key standards in this area include VDA 278 and ISO 12219 for VOC and semi-volatile organic emissions from interior materials, ISO 9227 and ASTM B117 for salt spray corrosion testing, and the IEC 60068 series for thermal shock and environmental simulation of automotive electronics. These tests support material qualification, OEM specification compliance, and regulatory approval across interior and exterior component categories.
Full capability details are available on our Automotive Materials and Environmental Testing page at https://www.alstesting.co.th/automotive-materials-environmental-testing-als-testing/
Chemical and Electronics Testing
Chemical testing in automotive applications covers two converging areas. The first is trace chemical analysis of materials and components: identifying and quantifying organic compounds, trace elements, restricted substances, and ionic contaminants using techniques including GCMS, ICP-MS, FTIR, and ion chromatography (IC).
The second is electronics-specific chemical testing, which has grown significantly as vehicle architectures shift toward electronics-intensive platforms. This includes ionic contamination testing of PCB assemblies by IC to IPC-TM-650, anion and cation analysis of flux residues and process chemical contamination, RoHS restricted substance screening to IEC 62321, and REACH SVHC screening for hazardous chemical content.
Ion chromatography – the basis of what is often called the anion test – is increasingly critical for automotive electronics manufacturers. It detects the anionic species that drive corrosion and leakage current failures in PCB assemblies: chloride, fluoride, sulfate, nitrate, phosphate, and organic acid anions from flux residues.
How Automotive Testing Fits the Manufacturing Lifecycle
Testing is not a single event at the end of a production run. In a well-structured quality system, it is integrated throughout the manufacturing lifecycle, with different test types serving different purposes at each stage.
Material and Supplier Qualification
Before a material or sub-component enters production, it needs to be qualified against the OEM specification. This typically involves a defined test programme covering chemical composition, mechanical performance, emissions, and where relevant, cleanliness. Qualification testing establishes the baseline – the evidence that the material or component, as supplied, meets the defined requirements. This is predominantly third-party laboratory work, because OEMs require accredited results.
Prototype and Development Testing
During development, testing is used iteratively. A material is selected, tested, modified based on results, and tested again. Failure analysis at this stage investigates unexpected results and guides design changes. The goal is to resolve weaknesses before they become production problems, when the cost of correction is manageable.
Production Quality Control
Once production is established, routine testing monitors process stability and product consistency. This is often a combination of in-house QC – simple checks that verify the process is running within limits – and periodic third-party testing to maintain the documented evidence of compliance. The frequency and scope of third-party testing during production is typically defined by the OEM or the quality plan.
Field Failure Investigation
When components fail in service, failure analysis traces the failure to its cause. This determines whether the failure represents a design defect, a manufacturing escape, a misapplication, or a warranty claim that is outside the supplier’s scope. The findings drive corrective action and, in more serious cases, inform recall or field campaign decisions. At this stage, the independence and accreditation of the laboratory producing the analysis matters significantly – both for the technical credibility of the conclusions and for their use as evidence in commercial or legal contexts.
Destructive vs Non-Destructive Testing
One practical distinction that matters when planning a test programme is whether the testing is destructive or non-destructive.
Destructive testing involves irreversible analysis. Cross-section preparation, chemical extraction, mechanical fracture testing – these all consume the sample. The benefit is that they yield the most detailed information about a component’s internal structure, material composition, and failure mechanism. The trade-off is that the tested sample cannot be returned to service or reused.
Non-destructive testing (NDT) allows a component to be evaluated and returned. Techniques such as SEM surface imaging, particle extraction (which does not damage the component structure), and X-ray inspection fall in this category. NDT is preferred where sample numbers are limited – for example, with prototype components or field returns where no duplicate is available.
In practice, a failure analysis investigation will often begin with non-destructive examination and progress to destructive techniques as the evidence trail narrows. The sequence is planned in advance to preserve the most informative analytical options.
Why Independent, Accredited Testing Matters
It is worth being direct about this. Not all testing is equal, and the difference between testing conducted by an ISO/IEC 17025 accredited independent laboratory and testing conducted in-house has concrete consequences.
ISO/IEC 17025 is the international standard for the competence of testing and calibration laboratories. Accreditation to this standard means that a laboratory’s methods, equipment calibration, analyst qualifications, and quality management system have been audited and verified by an independent accreditation body. The ILAC MRA – the Mutual Recognition Arrangement administered by the International Laboratory Accreditation Cooperation – extends this recognition globally, so that accredited results from a laboratory in Malaysia are accepted by OEMs and regulators in Europe, North America, and Japan without question.
There are three reasons this matters in practice.
OEM acceptance: the vast majority of global OEMs require accredited test data for qualification submissions, type approvals, and compliance evidence. In-house data, regardless of how it was generated, is generally not accepted for these purposes.
Liability protection: an independent test report provides documented, objective evidence of compliance at the time of manufacture. This evidence is critical when warranty claims, product liability disputes, or regulatory investigations arise. An independent report protects suppliers from unjustified claims.
Objectivity: an independent laboratory has no stake in the outcome. It reports what it finds. For any test result that will be used in a formal context – OEM submission, regulatory filing, legal proceedings – this independence is not optional.
ALS Testing is accredited to ISO/IEC 17025:2017, with results recognised under the ILAC MRA in more than 100 countries. Our test reports carry the formal ILAC MRA mark and are accepted by OEMs and regulatory authorities worldwide.
The laboratory you choose to partner with has direct consequences for your OEM relationships, your regulatory posture, and your ability to respond to quality issues with credible evidence.
Choosing the Right Laboratory for Automotive Testing
With multiple testing laboratories operating in Malaysia and across Southeast Asia, choosing the right partner requires more than a price comparison. A few dimensions worth evaluating:
Accreditation scope: confirm that the specific tests you require are within the laboratory’s accredited scope, not just offered as unaccredited services. The distinction matters for OEM and regulatory submissions.
Specialist capability: some test types – particularly cleanliness testing to ISO 16232 and VDA 19, and advanced failure analysis using SEM, FTIR, and EDX – require specialist equipment and methodological expertise that not every general testing laboratory has invested in.
Understanding of automotive context: raw analytical data has limited value without interpretation in the context of your manufacturing process and OEM specification. A laboratory that understands automotive manufacturing can tell you not just what the results show, but what they mean for your quality programme.
Turnaround and communication: production schedules and OEM submission deadlines are real constraints. A laboratory that communicates proactively from sample receipt through to report delivery reduces the risk of delays cascading into production or commercial consequences.
ALS Testing combines ISO/IEC 17025 accreditation, specialist cleanliness and failure analysis capability, and 40 years of global testing network experience with deep local knowledge of the Malaysian and Southeast Asian automotive market.
Ready to Discuss Your Testing Requirements?
Whether you are qualifying a new component for an OEM programme, investigating a failure, or establishing a testing protocol for a new material or platform, ALS Testing’s specialists are here to help.
See the full range of ALS automotive testing services: https://www.alstesting.co.th/automotive-testing-services-als-testing-laboratory/
Contact our team for a quotation or technical consultation: https://www.alstesting.co.th/contact-us/
Read moreMay 14, 2026
C3 (Critical Cleanliness Control®) — The Next Level of PCB Cleanliness Testing
ALS Testing Services (Thailand) Co., Ltd.
New Service
Special Offer : 2,000 baht
(Regular Price: 3,000 baht)
️ Promotional Details — Limited Time Offer
ALS is proud to offer C3 testing at a special introductory price:
Regular Price
Promotional Price
C3 Testing Service
฿3,000
✅ ฿2,000
️ Promotion Period: May 15 – August 14, 2026 (Limited-time offer — secure your slots early!)
The Hidden Threat on Every PCB
In today’s electronics manufacturing landscape, cleanliness is not just a matter of aesthetics — it is a fundamental quality and reliability requirement. Every printed circuit board (PCB) that passes through a production line is exposed to a wide range of potential contaminants: flux residues, ionic salts, process chemicals, airborne particulates, moisture, and even fingerprint oils from human handling.
What makes this especially dangerous is that many of these contaminants are invisible to the naked eye. A PCB may look perfectly clean under normal inspection — yet still carry enough ionic contamination to cause field failures months or years down the line.
The consequences of neglecting PCB cleanliness can be severe:
️ Moisture absorption by residual ionic salts
⚙️ Electrochemical corrosion of copper traces and solder joints
️ Electromigration and dendritic growth — microscopic conductive bridges forming between circuit traces
⚡ Leakage currents and short circuits
Complete board failure — often unpredictable and difficult to trace in the field
This is why cleanliness testing is no longer optional — it is a critical step in any robust quality assurance and reliability program.
What Is C3 (Critical Cleanliness Control®)?
C3 (Critical Cleanliness Control®) is a state-of-the-art, localized ionic cleanliness testing technology designed specifically to address the limitations of traditional cleanliness measurement methods.
At its core, C3 works by using ultra-pure deionized water as an extraction medium. A precisely controlled volume of water is applied to a specific, targeted area of the PCB surface. The water extracts ionic contaminants from that localized zone, and the resulting solution is then analyzed by measuring its electrical conductivity and resistance. From these measurements, the instrument calculates the Corrosivity Index (C.I.) — a standardized indicator of contamination level and potential corrosion risk.
The fundamental principle is elegant in its simplicity:
The more ionic contamination present, the higher the electrical conductivity of the extract → the higher the C.I. value → the greater the risk.
Conversely:
✅ Low C.I. = Clean PCB = Low corrosion risk = Reliable product
The Science Behind Ionic Contamination
To fully appreciate the value of C3 testing, it is important to understand why ionic contamination is so harmful at a fundamental level.
What Are Ionic Contaminants?
Ionic contaminants are electrically charged chemical species (ions) — both positively charged cations (e.g., Na⁺, K⁺, Ca²⁺) and negatively charged anions (e.g., Cl⁻, Br⁻, SO₄²⁻) — that remain on the PCB surface after manufacturing.
Common sources include:
Contamination Source
Typical Ionic Species
Solder flux residues
Organic acids, halide activators (Cl⁻, Br⁻)
Human handling
NaCl (sodium chloride) from perspiration
Process water
Calcium, magnesium, chloride ions
Atmospheric dust
Mixed ionic salts
Cleaning agent residues
Surfactant ions, alkaline species
PCB substrate outgassing
Various organic ionic compounds
⚠️ The Electrochemical Failure Mechanism
When ionic contaminants combine with moisture — even at normal ambient humidity levels — they form a thin electrolytic film on the PCB surface. In the presence of an applied electric field (i.e., a powered circuit), this sets off a chain of electrochemical reactions:
Ionic contamination+H2O+Electric field→Electrochemical corrosion+Dendritic growthIonic contamination+H2O+Electric field→Electrochemical corrosion+Dendritic growth
Dendritic growth (also called electrochemical migration or ECM) is particularly insidious: metallic ions dissolved from corroding conductors are redeposited as branching, tree-like conductive filaments that can bridge adjacent circuit traces, causing intermittent or permanent short circuits. These failures are notoriously difficult to diagnose after the fact.
Traditional Testing vs. C3 — Understanding the Difference
❌ Traditional Methods: ROSE Testing (Resistivity of Solvent Extract)
For decades, the industry relied primarily on ROSE (Resistivity of Solvent Extract) testing — standardized under IPC-TM-650 Method 2.3.25 — as the go-to cleanliness measurement. In ROSE testing, the entire PCB is immersed in a mixture of isopropyl alcohol (IPA) and deionized water, and the total ionic contamination of the whole board is measured.
While ROSE testing provides a useful global cleanliness benchmark, it has well-recognized limitations:
❌ It gives only a board-average result — it cannot identify where contamination is located
❌ High-risk localized zones (e.g., beneath dense IC packages) may have dangerous contamination levels that are diluted and masked by cleaner areas elsewhere on the board
❌ It cannot be performed on boards with components or coatings already applied
❌ Results are not spatially resolved — they provide no actionable guidance for process engineers
✅ C3: The Localized, Targeted Solution
C3 was developed precisely to overcome these limitations. Rather than flooding the entire board, C3 applies its extraction water to a precisely defined, small area — as small as a few square centimeters — enabling point-by-point contamination mapping of the PCB surface.
Feature
ROSE / Traditional Testing
C3 (Critical Cleanliness Control®)
Testing Area
Entire board (global average)
Specific localized zones
Spatial Resolution
None
High — point-by-point mapping
Under-component testing
❌ Not possible
✅ Capable (QFN, BGA, etc.)
Non-destructive
✅ Yes
✅ Yes
Speed
Moderate
⚡ Rapid — near-immediate results
Process trend monitoring
Limited
✅ Full C.I. trend tracking
Actionability
Low
High — identifies specific problem areas
Key Advantages of C3 Testing
1. Localized, Targeted Testing
Unlike global testing methods, C3 allows engineers to test exactly where it matters most — directly beneath high-density IC packages, in solder joint crevices, around connector interfaces, or any zone identified as high-risk. This targeted approach dramatically increases the sensitivity and relevance of the contamination data.
2. ⚡ Rapid, Real-Time Results
C3 delivers results almost immediately after sample extraction. This makes it ideal for in-line or at-line quality control, enabling rapid feedback during production rather than waiting for lengthy laboratory turnaround times.
3. Fully Non-Destructive
The C3 extraction process uses only ultra-pure water and causes zero physical or electrical damage to the PCB, its components, solder joints, or surface finishes. The tested board can proceed normally through the production process or be returned to the customer without any impact on its integrity.
4. Process Trend Monitoring and SPC Integration
Because C3 generates quantitative C.I. data for specific locations, it is perfectly suited to Statistical Process Control (SPC) integration. Engineers can plot C.I. values over time to:
Identify process drift before it causes failures
Evaluate the effectiveness of cleaning process changes
Establish and maintain cleanliness control limits
Generate compliance documentation for customers and auditors
5. Hidden Zone Inspection (Under-Component Testing)
One of the most powerful capabilities of C3 is its ability to assess contamination beneath components — including low-standoff packages such as QFN (Quad Flat No-Lead) and BGA (Ball Grid Array) devices, where conventional inspection is physically impossible. This is increasingly critical as component miniaturization continues and the standoff gap between package and PCB becomes ever smaller.
Applications Across the Electronics Manufacturing Lifecycle
C3 is a versatile tool applicable at multiple stages of PCB fabrication, assembly, and quality assurance:
✔️ 1. Post-Soldering Cleanliness Verification
After wave soldering, reflow soldering, or selective soldering operations, flux residues — especially from no-clean flux formulations — may remain on the PCB surface. C3 provides a quantitative measure of residual ionic contamination, enabling engineers to determine whether cleaning is required or whether the no-clean residues are within acceptable limits.
✔️ 2. Pre-Conformal Coating Inspection
Conformal coating is applied to protect PCBs in harsh environments (humidity, chemicals, vibration). However, if ionic contamination is present beneath the coating, moisture can penetrate and trigger under-coating corrosion and delamination, causing the coating to fail. C3 testing before coating application ensures that the substrate is clean and that the coating will perform as intended.
✔️ 3. In-Line Production Quality Control
C3 can be integrated into the production quality control workflow as a routine check at defined process stages. By monitoring C.I. values at regular intervals, manufacturing teams can maintain consistent cleanliness standards and rapidly detect when a process step (e.g., a solder paste applicator, a flux dispensing system, or a cleaning machine) begins to drift out of specification.
✔️ 4. PCB Failure Analysis (FA)
When a PCB is returned from the field due to a reliability failure, C3 is an invaluable tool in the failure analysis process. By mapping the contamination profile of specific areas on the failed board — and comparing it against reference (non-failed) boards — engineers can determine whether ionic contamination played a role in the failure and identify its likely source.
✔️ 5. Cleaning Process Validation and Optimization
When introducing or validating a new cleaning chemistry, cleaning machine, or cleaning process parameter, C3 provides the quantitative data needed to confirm that the process effectively removes contamination from all critical zones, including those beneath low-standoff components.
✔️ 6. Incoming Material and Bare Board Inspection
C3 can also be applied to bare PCB substrates and incoming solder paste or flux materials to verify their ionic contamination levels before they enter the production line — preventing contamination from being introduced at the very start of the manufacturing process.
Understanding the Corrosivity Index (C.I.)
The primary output of C3 testing is the Corrosivity Index (C.I.), a dimensionless numerical value derived from the electrical conductivity measurement of the extraction solution. The C.I. provides a direct, standardized, and comparable measure of ionic contamination for any tested location.
C.I. Interpretation Guide:
C.I. Value Range
Cleanliness Status
Risk Level
Recommended Action
Low ✅
Excellent — PCB is clean
Very Low
No action required; approve for next process
Moderate ⚠️
Acceptable — minor contamination
Low–Medium
Monitor trend; review process
High ❌
Contamination detected
High
Investigate source; consider re-cleaning
Very High ❌❌
Heavy contamination
Critical
Do not proceed; immediate corrective action
Note: Specific C.I. acceptance thresholds should be established based on the end-use application, customer requirements, and applicable industry standards (e.g., IPC-7711/7721, IPC-6012, IPC-A-610).
Industry Standards and Regulatory Context
The importance of PCB cleanliness is recognized and mandated by major international electronics industry standards:
IPC-7711/7721 — Rework, Modification and Repair of Electronic Assemblies
IPC-6012 — Qualification and Performance Specification for Rigid Printed Boards
IPC-A-610 — Acceptability of Electronic Assemblies
IPC-TM-650 2.3.25 — Ionic Cleanliness Testing
J-STD-001 — Requirements for Soldering Electrical and Electronic Assemblies
MIL-PRF-31032 / MIL-P-55110 — Military specifications for PCB reliability
C3 testing supports compliance with these standards by providing the localized, quantitative, and traceable cleanliness data that global testing methods cannot supply.
Contact Us
For inquiries, quotations, and sample submissions, please contact our Marketing Team:
+66 94 480 4705 +66 94 480 4706 +66 83 858 1323
➡️ Click here to view full promotion details
Read moreMay 13, 2026
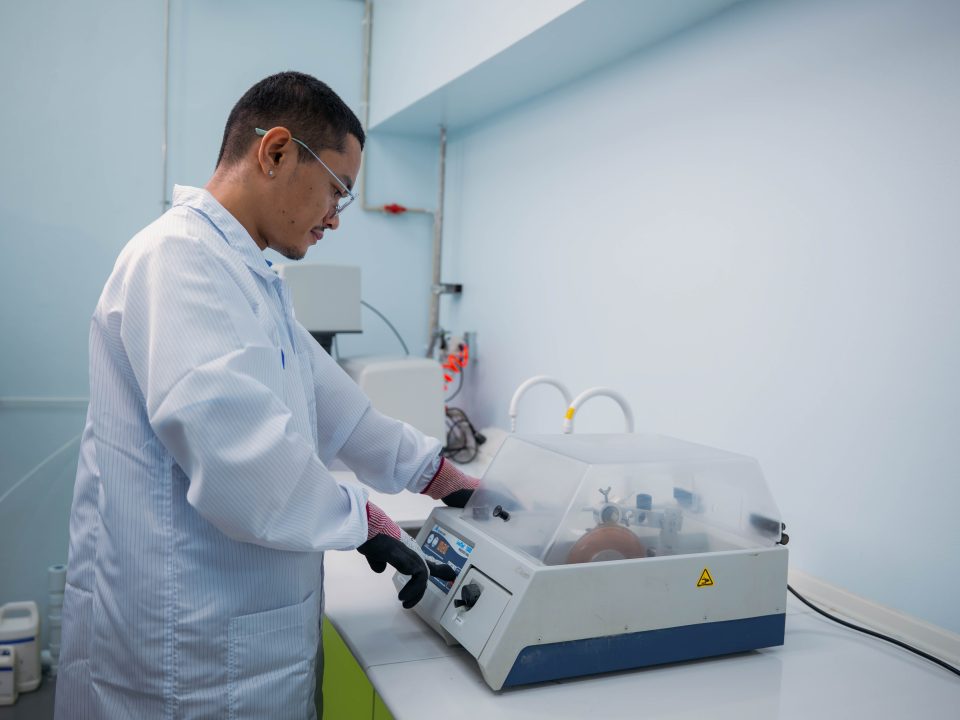
Cross-Sectional Analysis for Electronic Devices: Seeing What the Naked Eye Can’t
When the Real Problem Is Hidden Inside
In electronics manufacturing, the most critical defects are often the ones you can’t see. A hairline crack in a solder joint, a void in a plating layer, an invisible delamination between PCB layers — any of these can cause a device to fail unpredictably in the field, with consequences ranging from product recalls to safety incidents.
Cross-sectional analysis is the technique that makes the invisible visible. By physically sectioning a component and examining its internal structure with precision instruments, engineers gain access to information that no surface inspection can provide — and that information is often the difference between a reliable product and an expensive failure.
What Is Cross-Sectional Analysis — and Why Does It Matter?
Cross-sectional analysis involves preparing a material or device specimen by cutting, mounting, and polishing it to reveal a precise internal cross-section, then examining that section under high-powered microscopy. It’s routinely applied to PCBs, PCBAs (assembled boards), integrated circuits (ICs), and a wide range of other electronic and industrial components.
The Five Core Objectives
Table
Objective
What It Delivers
Defect Detection
Identifies incomplete connections, solder defects, and structural flaws before they cause failures in the field
Material Quality Assessment
Evaluates layer thickness, density, mechanical strength, and durability — informing better material selection decisions
Failure Analysis
Traces the root cause of device failures with scientific precision, not guesswork
Product Development
Reveals weaknesses in current designs and provides the data needed to build better, more reliable products
Cost Reduction
Catching defects early in production is dramatically cheaper than recalls, rework, or warranty claims downstream
Step-by-Step: The Cross-Sectional Analysis Process
Reliable results depend on rigorous, standardized preparation. Here’s how the process unfolds at ALS:
Stage 1: Sample Preparation
Document the sample Before any cutting begins, the specimen is photographed in full — capturing the overall condition and the specific area of interest. This creates a visual baseline for the entire analysis.
Precision cutting The specimen is cut using specialized equipment, maintaining a minimum distance of 1.0 cm from the region of interest to avoid cutting-induced damage. If the area is particularly sensitive, the sample is pre-mounted in epoxy resin to protect it during sectioning.
Ultrasonic cleaning The cut specimen is cleaned in an ultrasonic bath for 2–3 minutes, then thoroughly dried — removing any debris or contamination that could affect imaging quality.
Stage 2: Mounting (Casting)
The specimen is embedded in a precisely measured mixture of epoxy resin and hardener, cast into a mold that holds it securely in the correct orientation. Once fully cured, the mounted sample is carefully removed from the casting cup.
The casting cup is cleaned with IPA-soaked cloth after each use to remove cured resin residue — maintaining consistent mounting quality across samples.
✨ Stage 3: Grinding and Polishing
The mounted specimen is processed on a NANO 1000T Grinder-Polisher, working through progressively finer abrasives at controlled speeds until the cross-section surface is perfectly flat, smooth, and ready for microscopic examination.
Stage 4: Microscopic Analysis
Optical Microscopy Using a high-performance optical microscope at magnifications ranging from 10× to 500× (selected based on sample characteristics), the cross-section is systematically imaged and examined for visible defects, layer integrity, and structural anomalies.
SEM/EDX Analysis For deeper investigation, Scanning Electron Microscopy (SEM) provides nanometer-level resolution imaging of internal structures, while Energy Dispersive X-ray Spectroscopy (EDX) identifies the elemental composition of specific areas — revealing not just where a problem exists, but what it’s made of.
Stage 5: Reporting
Analysis data — including images, measurements, and compositional findings — is compiled into a comprehensive report. Results are presented with supporting graphics, charts, and clear scientific interpretation, making findings accessible to both technical and non-technical stakeholders.
The Technical Toolkit: Key Analysis Techniques
Optical Microscopy
Uses visible light to generate high-resolution images at the micrometer scale. The standard first step for examining solder joint quality, layer continuity, and surface-level defects in PCBs and electronic assemblies.
⚡ Electron Microscopy (SEM & TEM)
Replaces light with a focused electron beam to achieve nanometer-scale resolution — far beyond what optical microscopy can deliver. Essential for studying particle morphology, interface characteristics, and fine structural details that affect electrical and mechanical performance.
️ Metallographic Analysis
Chemical etching techniques are applied to reveal grain boundaries, phase distributions, and internal microstructure in metallic materials — enabling detailed assessment of structural continuity and micro-level defects.
Hardness Testing (Vickers / Rockwell)
Quantifies the mechanical properties of materials at the cross-section — including hardness, wear resistance, and strength — providing critical data for quality certification and material performance evaluation.
X-ray Analysis (XRD & XRF)
XRD (X-ray Diffraction) — Reveals crystal structure and phase composition of materials
XRF (X-ray Fluorescence) — Identifies elemental composition and detects contamination or impurities
Together, these techniques provide a complete chemical and structural picture of the material under investigation.
What Materials and Applications Can Cross-Sectional Analysis Examine?
Cross-sectional analysis is far more versatile than many realize. Beyond electronics, it has applications across virtually every field of materials science and engineering:
️ Electronic Materials
PCBs — Detecting soldering defects, delamination, via integrity issues, and layer thickness non-conformance
Electronic components — Capacitors, resistors, and ICs: internal structural assessment and material integrity verification
Metallic Materials
Metal alloys — Examining crystal structure, elemental distribution, and internal defects such as cracks or incomplete fusion
Industrial materials — Evaluating mechanical properties and wear resistance of steel and aluminum for structural and machinery applications
Chemical and Polymer Materials
Plastics and polymers — Analyzing internal structure, additive distribution, strength, and flexibility characteristics
Ceramic materials — Assessing internal structure, fracture resistance, and impact strength for industrial ceramic applications
Medical and Biomedical Research
Biological tissue — Studying cellular architecture, comparing cancerous and healthy cells, and evaluating tissue response to treatment
Vaccines and pharmaceuticals — Examining structural composition to assess formulation stability and efficacy
Social Sciences
Cross-sectional studies — Collecting population-level data at a single point in time to analyze factors influencing health outcomes, behaviors, and demographic trends — providing foundational data for longitudinal research
Why Choose ALS for Cross-Sectional Analysis?
ALS Testing combines state-of-the-art instrumentation — including high-performance optical microscopes, SEM/EDX systems, and precision grinding equipment — with years of hands-on expertise in electronics failure analysis and materials characterization.
Our ISO/IEC 17025 accredited laboratory ensures that every analysis is conducted to the highest international standards, with results that are scientifically defensible, clearly communicated, and ready to support your quality decisions.
Whether you’re investigating a field failure, validating a new manufacturing process, or developing the next generation of electronic products, cross-sectional analysis with ALS gives you the internal insight you need to get it right.
Contact ALS Testing Services (Thailand)
ALS Testing Services (Thailand) Co., Ltd. Advanced chemical analysis and materials testing — powered by modern technology and specialist expertise.
Tel: +(66) 2700 9665 Email: pathumthani@alsglobal.com
When surface inspection isn’t enough — cut deeper with ALS. Contact our team today to discuss your cross-sectional analysis requirements.
Read moreMay 13, 2026
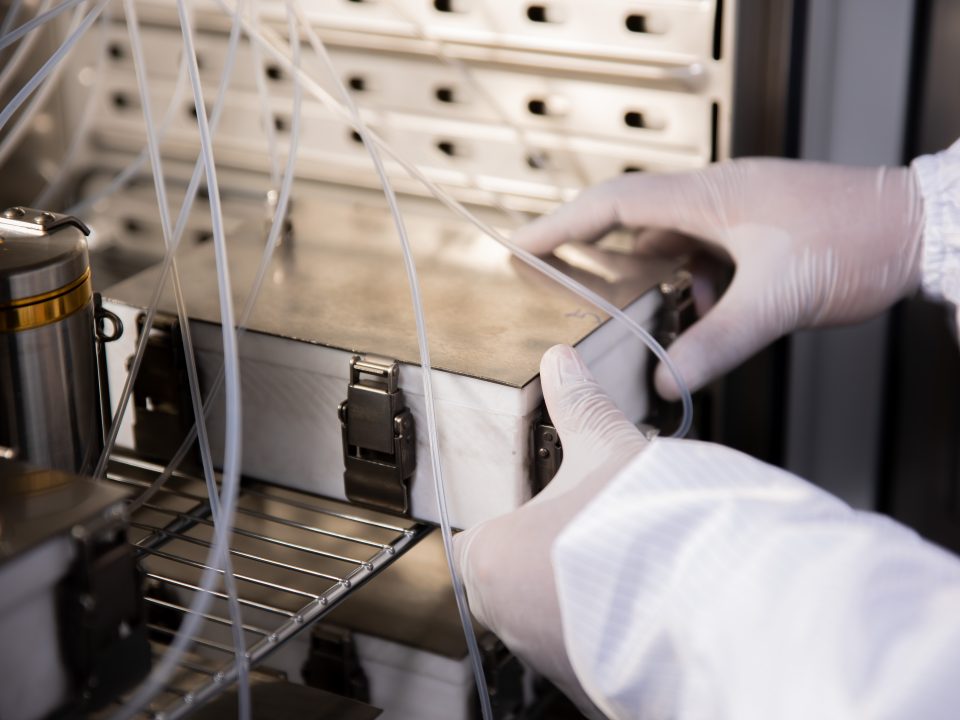
Volatile Organic Compounds (VOCs): What They Are, Why They Matter, and How to Measure Them
The Invisible Chemicals Around Us
They’re in the paint on your walls, the fuel in your car, the cleaning products under your sink — and quite possibly, the air you’re breathing right now. Volatile Organic Compounds (VOCs) are a family of chemicals so pervasive that most people encounter them daily without realizing it.
VOCs are liquid or solid chemical compounds with low boiling points, meaning they evaporate easily at room temperature and enter the air we breathe. While some are relatively harmless, others pose serious risks to human health and the environment — making accurate detection, measurement, and control essential for industries, regulators, and communities alike.
Meet the Key Players: Common Types of VOCs
Benzene
A colorless aromatic hydrocarbon found in petrol, diesel, paints, and solvents. Benzene is classified as a known human carcinogen, with established links to leukemia and damage to the nervous system. Even low-level, long-term exposure carries significant health risks.
Formaldehyde
A colorless, pungent gas that dissolves readily in water. Widely used in wood-based manufacturing (plywood, particleboard) and household cleaning products, formaldehyde causes respiratory irritation, eye and skin reactions, and is associated with increased cancer risk with prolonged exposure.
Toluene
A benzene-like hydrocarbon with an added methyl group, found in petrol, solvents, and paints. Exposure to toluene can cause dizziness, headaches, and neurological impairment — particularly in poorly ventilated environments.
Xylene
A hydrocarbon with two methyl groups, used extensively in paint production, solvents, and fuels. Xylene exposure affects the eyes, respiratory system, and nervous system, and can be especially hazardous in occupational settings.
Where Do VOCs Come From?
VOC emissions come from a surprisingly wide range of sources — both natural and human-made:
Natural Sources
Decomposing organic matter — When plants and animals break down, bacteria release VOCs such as methane and ethylene as byproducts
Natural seepage — Petroleum deposits and geothermal activity can release VOCs naturally into the atmosphere
Combustion Sources
Industrial fuel burning — Power generation, manufacturing facilities, and industrial boilers burning oil, coal, or gas release significant VOC emissions
Vehicle exhaust — Fossil fuel-powered vehicles are a major source of urban VOC pollution, contributing to smog formation and air quality degradation
Industrial Sources
Manufacturing processes — Production of paints, solvents, rubber, plastics, and specialty chemicals involves extensive use of VOCs
Industrial operations — Equipment cleaning, maintenance, and chemical handling all generate VOC releases that must be carefully managed
Everyday Sources
Household products — Wall paints, cleaning agents, bleaches, fuels, and dry-cleaning fluids all contain VOCs that off-gas into indoor air
Home appliances — Printers, air conditioners, and other devices can emit low levels of VOCs during operation
The Health Impact: What VOC Exposure Does to the Body
Table
Health Effect
Symptoms & Consequences
️ Irritation
Eye, nose, and throat irritation — often the first sign of exposure
Respiratory problems
Breathing difficulties, airway constriction, worsening of asthma
Neurological effects
Dizziness, confusion, insomnia, and memory impairment
⚠️ Cancer risk
Certain VOCs (notably benzene) are classified carcinogens with documented links to leukemia
Environmental Consequences: Beyond Human Health
VOCs don’t just affect people — they damage the world around us:
Air Quality
VOCs react with nitrogen oxides in sunlight to form photochemical smog — the hazy, harmful air pollution common in urban areas. This ground-level ozone damages respiratory systems and reduces visibility.
Water Quality
When VOCs enter water bodies through spills or runoff, they become toxic to aquatic life — disrupting ecosystems and contaminating drinking water sources.
Soil Quality
VOCs that leach into soil inhibit plant growth and degrade soil health, with long-term consequences for agriculture and natural ecosystems in contaminated areas.
Controlling VOC Emissions: A Multi-Layer Approach
1. Standards and Legislation
Thailand has established regulatory limits for key VOCs in ambient air — for example:
Benzene: ≤ 1.7 µg/m³ annually
Vinyl Chloride: ≤ 10 µg/m³ annually
The Pollution Control Department enforces industry-specific VOC emission limits, backed by legally binding regulations.
2. Monitoring and Reporting
Continuous air quality monitoring in high-risk zones — near industrial facilities and fuel storage sites — tracks VOC levels in real time
Industry self-auditing ensures ongoing compliance and transparency in emissions reporting
⚙️ 3. Source Control
Vapor recovery systems at fuel storage facilities and service stations capture VOC emissions before they escape into the atmosphere
Process optimization in manufacturing reduces VOC usage and improves efficiency — achieving the same output with lower chemical inputs
4. Public Awareness and Participation
Community education on VOC risks and safe product use empowers people to reduce personal exposure
Environmental governance frameworks that include public participation create shared accountability for air quality in communities
How VOCs Are Measured: The Science of Detection
Accurate VOC measurement is the foundation of effective control — and the methods vary depending on whether you’re testing air, water, or soil.
VOC Measurement in Air
Sample Collection Air samples are collected using adsorption tubes or continuous sampling systems, where VOCs are captured at low temperatures onto an adsorbent material for later analysis.
Key Technologies:
Table
Technology
How It Works
PID (Photoionization Detector)
Uses a UV lamp to ionize organic gases, enabling rapid real-time concentration measurements in the field
GC-MS (Gas Chromatography–Mass Spectrometry)
Separates and identifies individual VOC compounds with high precision — the gold standard for laboratory air analysis
Result: Real-time concentration data that enables immediate response to pollution events and supports regulatory compliance monitoring.
VOC Measurement in Water
Sample Collection Water samples are collected in sealed, airtight containers to prevent evaporation during transport to the laboratory — a critical step that preserves sample integrity.
Key Technologies:
Table
Technology
How It Works
GC-MS
Analyzes VOCs in water after sample preparation (e.g., salting out to concentrate compounds) for precise identification and quantification
HSGC (Headspace Gas Chromatography)
Forces dissolved VOCs to volatilize into the headspace above the sample, then analyzes the vapor — ideal for water matrices
Result: Accurate VOC concentration data essential for drinking water safety assessments and environmental compliance monitoring.
VOC Measurement in Soil
Sample Collection Soil samples are collected from multiple locations and sealed immediately in airtight containers to minimize VOC loss through evaporation — maintaining the reliability of results.
Key Technologies:
Table
Technology
How It Works
SPE (Solid Phase Extraction)
Isolates and purifies VOC compounds from the soil matrix before analysis
GC-MS
Identifies and quantifies VOC contaminants in soil with high sensitivity and specificity
Result: Soil VOC data enables comprehensive environmental risk assessment — particularly critical for sites with a history of industrial activity, fuel spills, or chemical contamination.
Why Professional VOC Analysis Matters
Whether you’re an industrial operator managing emissions compliance, an environmental consultant assessing a contaminated site, or a manufacturer verifying product safety, accurate VOC analysis requires both sophisticated instrumentation and experienced scientific interpretation.
The consequences of getting it wrong — regulatory penalties, health liabilities, environmental damage — are far greater than the cost of getting it right.
ALS Testing Services (Thailand) Co., Ltd. _ Your VOC Analysis Partner
ALS Testing Services (Thailand) Co., Ltd. provides comprehensive VOC analysis across air, water, and soil matrices — powered by advanced analytical technology and a team of experienced specialists.
Our capabilities include:
✅ GC-MS analysis for precise VOC identification and quantification
✅ Headspace GC for liquid and water-phase VOC testing
✅ Field and laboratory sampling support
✅ Results delivered to international standards with full technical interpretation
Tel: +(66) 2700 9665
Email: pathumthani@alsglobal.com
From regulatory compliance to product safety verification — contact ALS Testing today for VOC analysis you can rely on.
Read moreMay 13, 2026
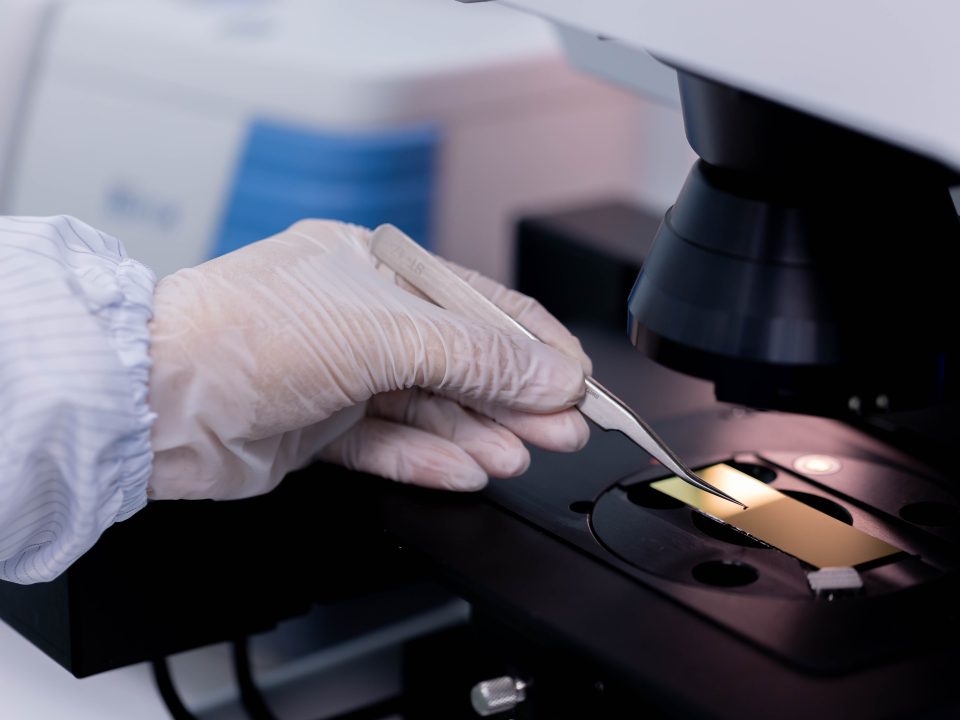
Component Cleanliness: The Hidden Factor That Keeps Industry Running
When Clean Isn’t Just Tidy — It’s Critical
In precision manufacturing, a single microscopic particle in the wrong place can bring an entire system to a halt. Component cleanliness — the rigorous process of ensuring that manufactured parts are free from contamination — is one of the most important yet often overlooked disciplines in modern industry.
Whether you’re producing automotive parts, aircraft components, electronic assemblies, or industrial machinery, contamination control isn’t a finishing step. It’s a fundamental quality requirement that directly impacts performance, safety, and service life.
7 Reasons Component Cleanliness Can’t Be Ignored
1. Preventing Wear and Component Damage
Unwanted particles — dust, metal shavings, oil residues — act like sandpaper inside precision mechanisms. When contaminants infiltrate moving parts, they accelerate friction and wear, causing components to degrade far faster than designed. Proper cleaning dramatically extends component service life and protects the investment in precision manufacturing.
⚙️ 2. Eliminating Jamming and Operational Irregularities
In systems where components move or interact — such as engines, hydraulic circuits, or pneumatic systems — even minor contamination can disrupt smooth operation. The result? Sluggish movement, unexpected jamming, or complete system seizure. Clean components move as designed: reliably, smoothly, and without interruption.
3. Reducing Fire and Explosion Risk
In chemical processing and aerospace applications, contamination isn’t just a mechanical problem — it can be a safety hazard. Accumulated chemical residues or reactive substances inside components can trigger unintended chemical reactions or generate dangerous heat buildup. Regular cleaning eliminates this risk before it becomes a crisis.
4. Protecting Product Quality
In electronics and pharmaceutical manufacturing, even trace-level contamination on sensitive components can compromise the entire product — causing functional defects, failed inspections, or non-compliance with quality standards. Component cleanliness ensures that what comes off the production line meets specification, every time.
5. Preventing Cascading Production Problems
Contamination doesn’t stay in one place. Dirty components introduce particles into manufacturing equipment, causing blockages, inconsistent outputs, and efficiency losses that compound over time. Cleaning at each stage of production keeps the entire manufacturing process running smoothly — preventing small problems from becoming expensive shutdowns.
6. Reducing Maintenance Costs
Clean components simply last longer and break down less frequently. By preventing contamination-related damage, regular cleanliness protocols significantly reduce repair and replacement costs — delivering measurable savings over the life of equipment and machinery.
7. Meeting Industry Standards and Regulatory Requirements
Component cleanliness is not just good practice — in many industries, it’s a mandatory requirement. Standards such as ISO, ASTM, VDA 19, and ISO 16232 define specific cleanliness thresholds that must be met. Compliance protects product quality, supports certification, satisfies legal obligations, and demonstrates a genuine commitment to safety.
The Bottom Line
Component cleanliness is one of the most cost-effective investments in manufacturing quality. When contamination is controlled:
✅ Components last longer ✅ Systems run more reliably ✅ Production processes stay efficient ✅ Safety risks are minimized ✅ Products consistently meet international standards
Neglecting it, on the other hand, invites a cascade of preventable failures — from premature wear and system downtime to product recalls and safety incidents.
ALS Testing: Your Partner in Cleanliness Verification
ALS Testing Services provides a comprehensive range of component cleanliness testing and analysis capabilities — giving you the scientific data to verify cleanliness levels, identify contamination sources, and make confident quality decisions.
Our Testing Instruments and Capabilities
Table
Instrument / Method
What It Does
FT-IR & FT-IR Microscopy
Identifies organic contaminants, polymer residues, and unknown substances on component surfaces
Liquid Particle Counter (LPC)
Measures and counts suspended particles in liquid — ideal for hydraulic fluids and cleaning baths
VDA 19 / ISO 16232-2018 Particle Analysis
Industry-standard measurement and counting of particles on automotive components
Ion Chromatography (IC)
Quantifies residual ionic contamination — critical for corrosion prevention and electronic reliability
HPLC (High Performance Liquid Chromatography)
Separates and analyzes complex chemical mixtures including coatings, additives, and process residues
SEM/EDX
High-resolution surface imaging combined with elemental analysis — pinpoints the composition and origin of contamination particles
GC/MS (Liquid & Gas Sample Preparation)
Identifies and quantifies volatile and semi-volatile organic compounds in both liquid and gas-phase samples
Why Choose ALS?
✅ ISO/IEC 17025 accredited laboratory — internationally recognized, reliable results
State-of-the-art analytical instruments — the right tool for every contamination challenge
Experienced specialist team — expert interpretation and actionable recommendations
Serving multiple industries — automotive, electronics, aerospace, pharmaceutical, and more
Contact ALS Testing Services (Thailand)
ALS Testing Services (Thailand) Co., Ltd. Advanced chemical analysis and materials testing — powered by modern technology and specialist expertise.
Tel: +(66) 2700 9665
Email: pathumthani@alsglobal.com
Don’t leave cleanliness to chance. Contact our team today to find the right testing solution for your components and your industry.
Read moreMay 13, 2026
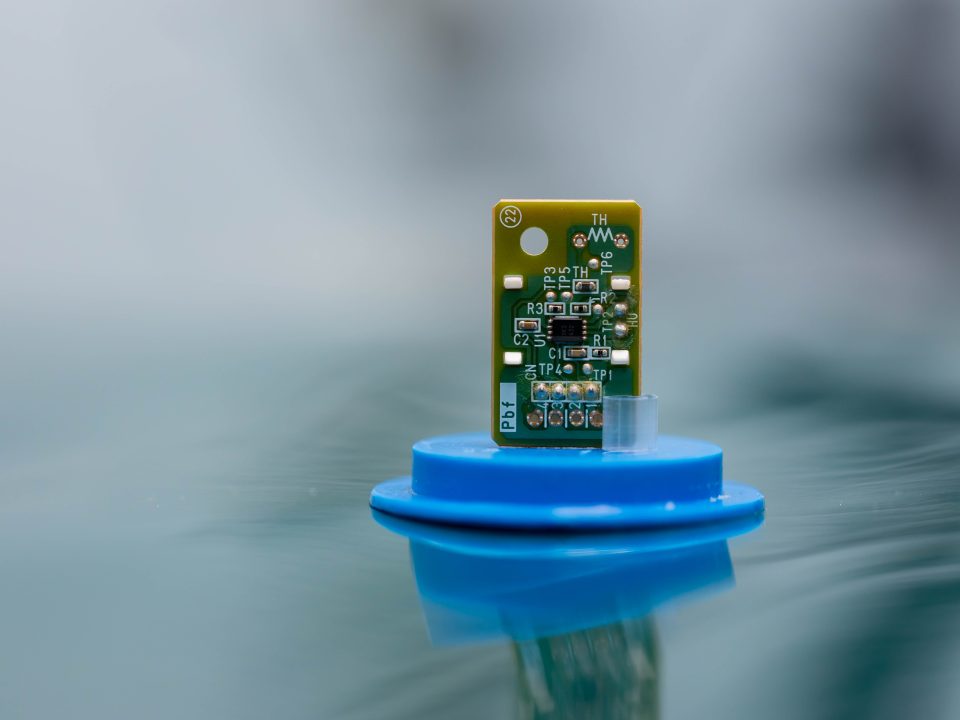
PCB Testing: Ensuring Every Circuit Performs When It Matters Most
The Tiny Board Behind Every Big Technology
From the smartphone in your pocket to life-saving medical devices and satellite systems, Printed Circuit Boards (PCBs) are the invisible backbone of modern electronics. These precisely engineered boards use etched copper pathways on insulating substrates to mount and connect electronic components — and when they fail, everything built around them fails too.
That’s why PCB testing isn’t optional. It’s essential.
Comprehensive testing throughout the design, manufacturing, and assembly stages is the only reliable way to ensure a PCB will perform consistently and safely — across every application, in every environment it was built for.
Why PCB Testing Is Non-Negotiable
1. Quality Assurance That Protects Your Product
A PCB defect doesn’t stay confined to the board — it becomes a system failure. Testing identifies and resolves issues before a defective board ever makes it into a finished product, safeguarding both performance and reliability.
2. Catching Problems Early Saves Money
The earlier a defect is found, the cheaper it is to fix. Detecting a fault on the production line costs a fraction of what it costs to address the same problem after assembly, shipping, or — worst of all — after a customer complaint. PCB testing directly reduces rework, scrap, warranty claims, and recall costs.
3. ️ Reliability Where It Counts Most
PCBs power some of the world’s most critical systems — medical devices, aerospace equipment, industrial controls. In these applications, failure isn’t just inconvenient; it can be dangerous. Rigorous testing ensures every board meets the reliability standards required to perform under demanding, real-world conditions.
4. Defect Detection Across the Full Spectrum
PCB testing covers a wide range of potential failure modes:
Short circuits and open circuits
Soldering defects
Component misplacement or misalignment
Material inconsistencies
Thorough testing catches these issues systematically — not by chance.
5. ✅ Process Verification, Not Just Product Inspection
PCB testing isn’t just about finding what went wrong — it verifies that the entire manufacturing process is working correctly. From etching and drilling to soldering and component placement, testing confirms that every step consistently meets specification.
6. ⚡ Functional Verification
Beyond physical inspection, PCBs must be verified to work as intended. This means testing:
Electrical connectivity
Signal integrity
Component functionality across the entire board
7. ️ Environmental Stress Testing
Depending on the application, PCBs may face extreme temperatures, high humidity, vibration, or thermal cycling in service. Environmental testing determines whether a board can withstand these stresses without performance degradation — a critical checkpoint for any product going into challenging conditions.
Testing Standards: The Framework for PCB Quality
PCB testing is governed by widely recognized international standards that define acceptance criteria and test methodologies. The most commonly applied specifications include:
Table
Standard
Application
IPC-6012
Qualification and performance for rigid PCBs
IPC-6013
Flexible and rigid-flex printed boards
IPC-6016
High-density interconnect (HDI) boards
IPC-6018
Microwave end-product boards
MIL-PRF-55110
Military-grade rigid PCBs
MIL-P-50884
Military flexible printed wiring
MIL-PRF-31032
Military printed circuit board manufacturing
Testing to these standards ensures your PCBs meet both commercial and defense-grade quality benchmarks — supporting certification, supplier qualification, and market access globally.
ALS PCB Testing Capabilities
ALS Testing provides a comprehensive suite of PCB testing services covering both raw materials and fully assembled PCAs (Printed Circuit Assemblies). Our capabilities include:
Ionic Cleanliness Testing (IC / ROSE)
Ionic Contamination (IC) testing and Resistivity of Solvent Extract (ROSE) testing measure the level of ionic contamination on a PCB surface — residues from flux, cleaning agents, or handling that can cause corrosion, current leakage, or dendritic growth over time.
Even trace ionic contamination can significantly shorten a PCB’s service life, particularly in high-humidity environments.
Advanced Instrumental Analysis: FT-IR & SEM/EDX
FT-IR (Fourier Transform Infrared Spectroscopy) Identifies organic compounds, polymer residues, contaminants, and coating materials on PCB surfaces. Ideal for pinpointing the chemical nature of unknown substances affecting board performance.
SEM/EDX (Scanning Electron Microscopy with Energy Dispersive X-ray Analysis) Delivers high-resolution surface imaging combined with precise elemental analysis — enabling detailed investigation of solder joint quality, surface contamination, corrosion mechanisms, and coating integrity at the microscale.
IPC-TM-650 Test Methods
A comprehensive set of standardized test procedures covering mechanical, chemical, electrical, and environmental properties of PCB materials and assemblies — the industry’s definitive testing reference.
️ Thermal Analysis: DSC & TGA
DSC (Differential Scanning Calorimetry) Measures thermal properties such as glass transition temperature (Tg), melting point, and cure state of PCB laminates — critical data for predicting how a board will behave at operating temperatures.
TGA (Thermogravimetric Analysis) Evaluates material stability and decomposition behavior under heat — essential for understanding the long-term thermal durability of PCB materials.
Cross-Section Analysis
One of the most revealing techniques in PCB failure investigation. Cross-sectioning exposes the internal structure of through-holes, vias, solder joints, and plating layers — allowing direct visual assessment of manufacturing quality and the root cause of failures that aren’t visible from the surface.
The ALS Advantage: Experience You Can Rely On
ALS Testing has been delivering PCB quality testing for many years, building deep expertise across a wide range of board types, standards, and failure scenarios.
When a problem is detected, our team doesn’t just report a result — we help you understand it. From evaluating overall board quality to conducting thorough failure analysis, ALS provides the scientific insight and technical guidance needed to resolve issues efficiently and prevent them from recurring.
Summary: Build Boards You Can Trust
PCB testing is one of the highest-return investments in electronics manufacturing. It protects your product quality, reduces costs, ensures regulatory compliance, and — most importantly — ensures that the products you put into the world work reliably for the people who depend on them.
Whether you’re qualifying new materials, investigating a field failure, or implementing ongoing quality control, ALS Testing has the accreditation, the instruments, and the expertise to deliver results you can act on.
ALS Testing Services (Thailand) Co., Ltd. Advanced chemical analysis and materials testing
— powered by modern technology and specialist expertise.
Tel: +(66) 2700 9665
Email: pathumthani@alsglobal.com
Let’s make sure your PCBs perform exactly as designed — every time. Reach out to our team today.
Read more